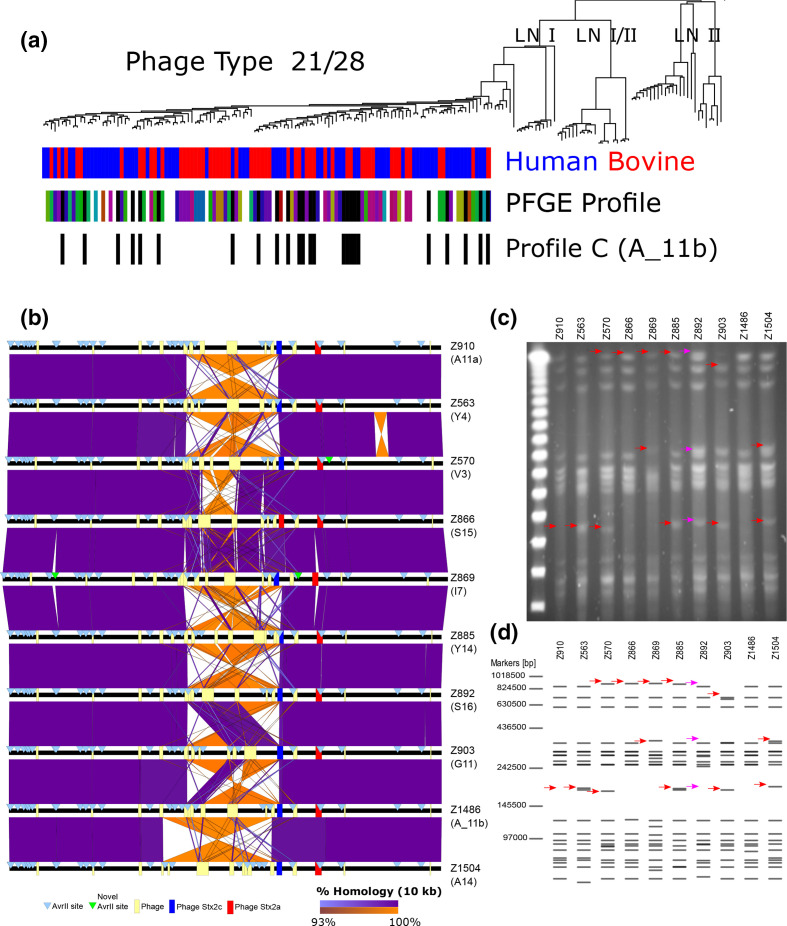
Fig. 3.
Distinct PFGE restriction patterns of E coli O157:H7 PT21/28 strains are largely accounted for by LCRs. (a) Phylogenetic distribution of lineage Ic PT21/28 strains. The strain source attribution, human (red) or bovine (blue), for each strain is indicated at each branch tip. Where available, the distinct PFGE profile types of PT21/28 strains are indicated at branch tips (coloured blocks) and those with profile C (A_11b) are highlighted (black blocks). (b) Pairwise whole-genome comparison of ten PT21/28 strains with different PFGE profiles. Whole genomes (black lines) are centred by the replication terminus (Ter) and loci of prophage (yellow boxes), Stx prophage (ΦStx2c;blue and ΦStx2a;red) and AvrII sites (blue triangles) are shown. Direct (purple) and inverted (orange) homology at a blast cut-off of 10000 bp between strains are plotted. (c) PFGE profile of the ten selected PT21/28 strains following AvrII digestion. (d) In silico generated AvrII digestion pattern of the PacBio-generated sequences for each strain. Distinguishing bands for each strain (red arrows) and bands of difference between in silico and AvrII digestion of strain Z892 (pink arrows) are highlighted.

