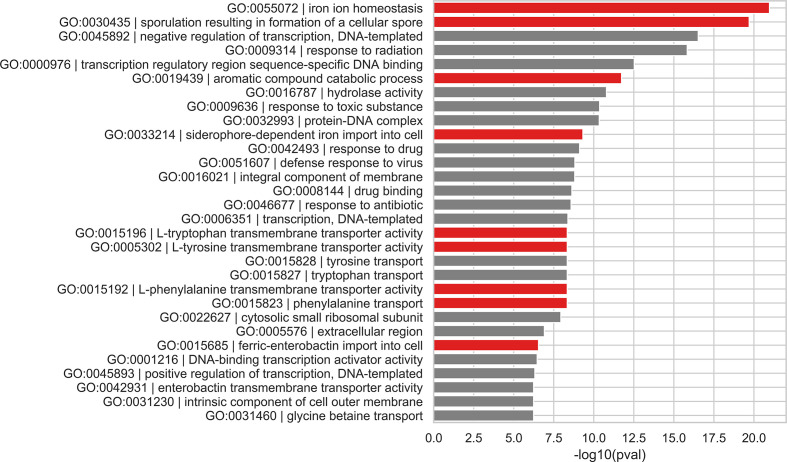
Fig. 2.
Gene enrichment analysis identifying the unique carbon catabolome and iron acquisition mechanisms in the soil isolate, DS002; bar plot of GO terms significantly enriched in DS002. GO IDs and term names are displayed on the y-axis, and the x-axis shows the −log10(P-value) of each GO term. GO terms associated with specialized mechanisms for carbon catalysis and iron acquisition are in red.

