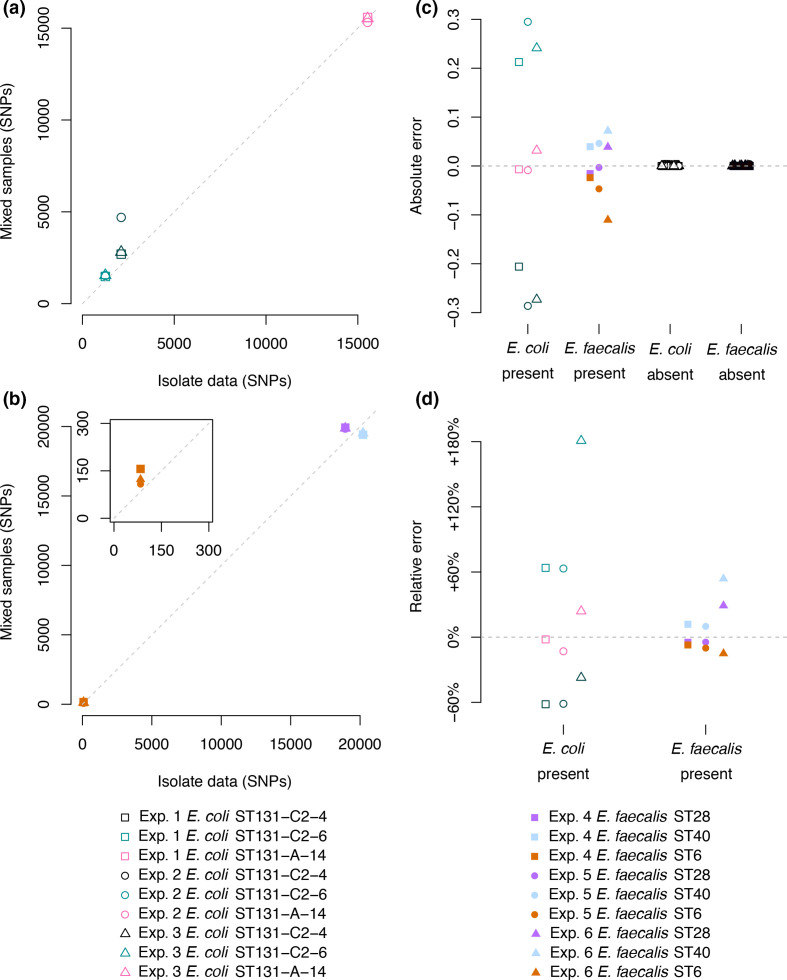
Fig. 2.
Evaluating mGEMS and mSWEEP on the in vitro benchmark data. Panels (a) E. coli and (b) E. faecalis compare the results of SNP calling from the isolate sequencing data (horizontal axis) against the results of SNP calling from the mixed samples with the mGEMS pipeline (vertical axis). The subplot in panel (b) contains a zoomed-in view of the points around the origin. Panels (c) and (d) compare the abundance estimates from mSWEEP to the ground truth relative abundances. Panel (c) shows the absolute difference between the estimates from mSWEEP and the true abundance. The values shown are split into E. coli and E. faecalis lineages truly present in the samples, and lineages truly absent. Panel (d) shows the relative error in the truly present lineages.

