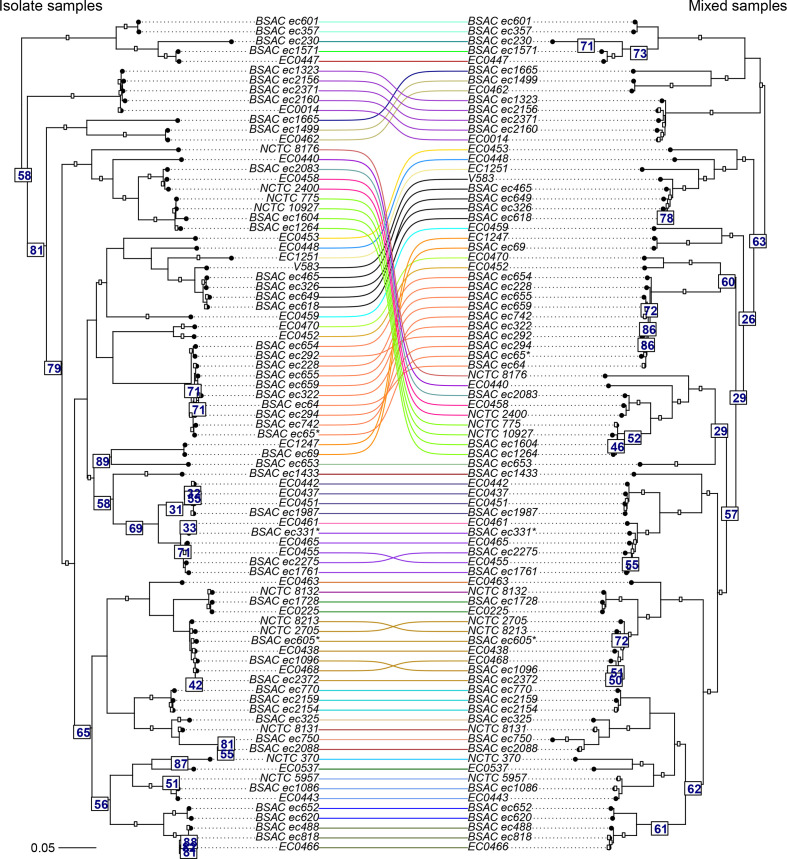
Fig. 5.
Tanglegram of two midpoint-rooted maximum likelihood trees from core SNP alignment of E. faecalis strains. The phylogeny labelled Isolate samples (left side of the tree) was inferred with RAXML-NG from assembling the isolate sequencing data from 84 E. faecalis strains. The phylogeny labelled Mixed samples (right side of the tree) was inferred from 12 synthetic mixed samples, each containing sequencing data from seven different E. faecalis STs randomly chosen from the isolate sequencing data. Numbers below the edges indicate bootstrap support values from RAxML-NG for the next branch towards the leaves of the tree. Only support values less than 90 are shown. Branches are coloured according to the E. faecalis STs, and branch lengths in the tree scale with the mean number of nucleotide substitutions per site on the respective branch (GTR+G4 model). Leaves are labelled with the strain name from NCBI and the leaf labelled V583 corresponds to the reference strain for calling the core SNPs.

