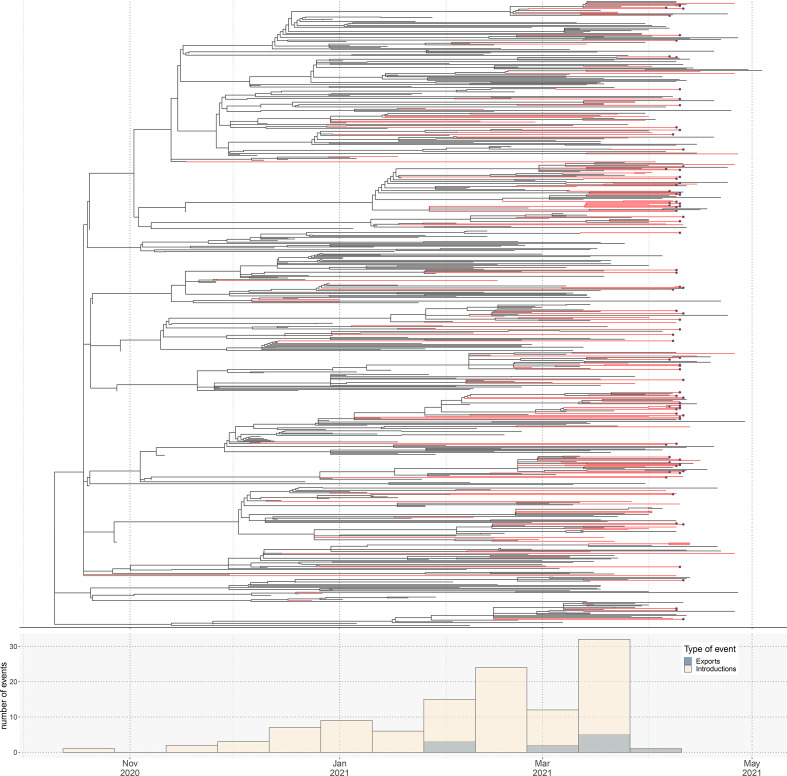
Fig. 1.
Phylogeny of B.1.1.7 (Alpha) including genomes from Pakistan. At the top, the maximum-likelihood dated tree of lineage B.1.1.7 (Alpha), showing only samples close to sequences related to Pakistan. Branches are coloured red when all descendant tips have Pakistan as the country of exposure. Samples sequenced in the present study are highlighted as red dots. At the bottom we have the histogram of introductions into and exportations out of Pakistan over time, as estimated by ancestral state reconstruction. Phylogenetic tree was estimated with IQTREE2 followed by divergence times estimation using TreeTime after excluding outliers. The figure was plotted with ggtree and introduction events were estimated by ancestral reconstruction under parsimony with the R package castor.

