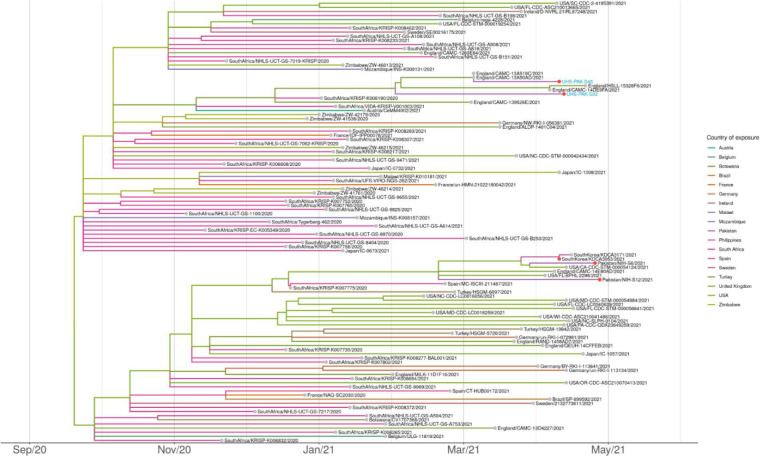
Fig. 3.
Maximum-likelihood dated tree of lineage B.1.351 (Beta) focused on samples sequenced in this study. Branches are coloured according to country of exposure, with Pakistan highlighted with a red circle. The two samples from the current study, UHS-PAK-S45 and UHS-PAK-S93, are labelled in blue. Phylogenetic tree was estimated with IQTREE2 [23] followed by divergence times estimation using TreeTime after excluding outliers. The figure was plotted with ggtree [27].

