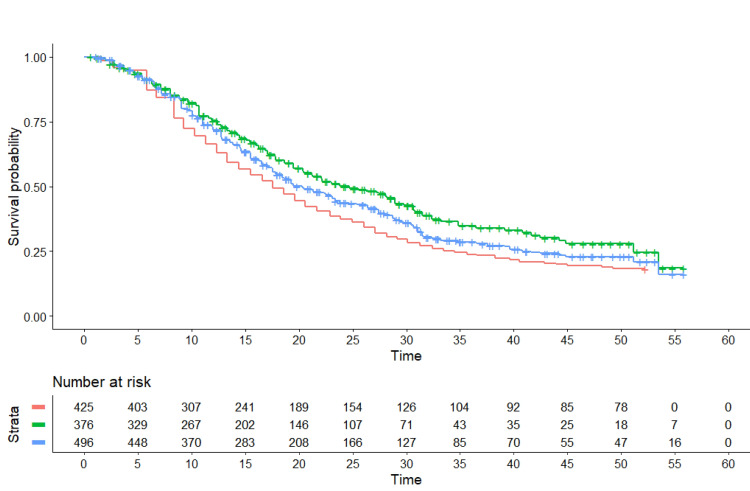
Figure 1. Kaplan-Meier curves from reconstructed patient-level data.
These three survival curves refer to PD-L1 positive patients and were obtained by reconstruction of individual patient data from two trials for atezolizumab (IM-PASSION-130 and IM-PASSION-131) and one for pembrolizumab (KEYNOTE-355). The cohorts given atezolizumab consisted of 376 patients (IM-PASSION-130, N=185; IM-PASSION-131, N=191). Pembrolizumab included 425 patients. The control groups of the three trials, pooled together, included 496 patients. End-point of the curves: overall survival. Symbols: atezolizumab in green, pembrolizumab in red, controls in blue; time expressed in months.

