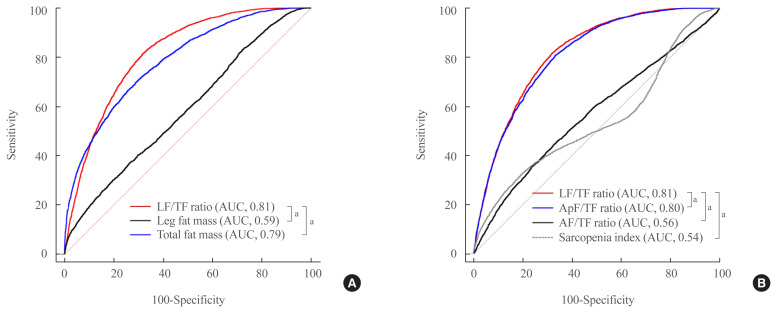
Fig. 4.
Comparison of receiver operating characteristic (ROC) curves to predict non-alcoholic fatty liver disease (NAFLD) defined by the comprehensive NAFLD score (CNS). (A) Comparison of the leg fat to total fat (LF/TF) ratio, total fat mass, and leg fat mass. (B) Comparison of the LF/TF ratio, arm fat to total fat (AF/TF) ratio, appendicular fat to total fat (ApF/TF) ratio, and sarcopenia index. AUC, area under the curve. aP<0.0001.

