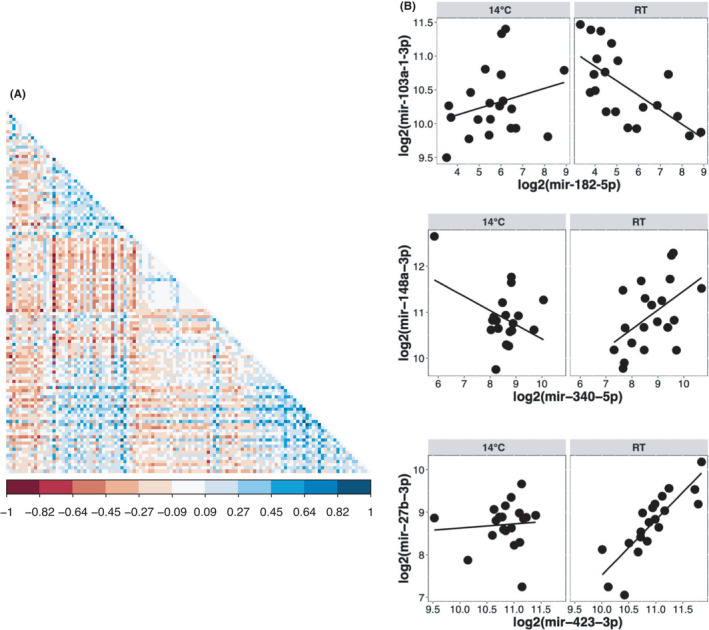
FIGURE 6.

Differential correlation analysis of circulating miRNAs. Differential correlation analysis was conducted with 118 miRNAs to identify miRNA pairs that show significantly different correlations at 14°C compared to RT. (A) Hierarchical clustering of correlogram based on differences in correlation values at 14°C and RT. Each cell is the difference in correlation of a miRNA pair and is coloured according to the colour key shown at the bottom. (B) Examples of differential correlations among miRNA pairs. Correlations at 14°C and RT are shown side by side for miRNA pairs listed on the x‐ and y‐axis (in log 2 expression units)
