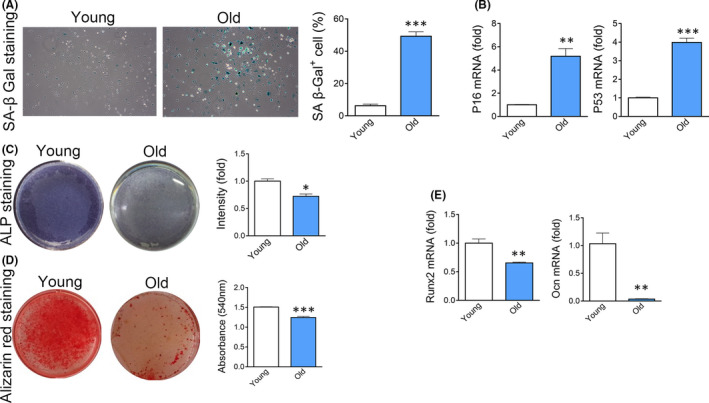
FIGURE 1.

Senescence of BMSCs derived from old mice. (A) Expression of SA β‐Gal in BMSCs derived from young or old mice. n = 5. (t test) (B) Real‐time analysis of senescence marker gene P16INK4a and P53 in BMSCs derived from young or old mice. n = 3. (t test) (C) ALP staining of BMSCs derived from young or old mice after 7 days of osteogenic induction. n = 4. (t test) (D) Alizarin red staining of BMSCs derived from young or old mice after 14 days of osteogenic induction. n = 4. (t test) (E) Expression of Runx2 and Ocn in BMSCs derived from young or old mice after 14 days of osteogenic induction. n = 3. (t test) Data are shown as mean ± SD. *p < 0.05, **p < 0.01, ***p < 0.001. NS, no significance. n, the number of biological replicated
