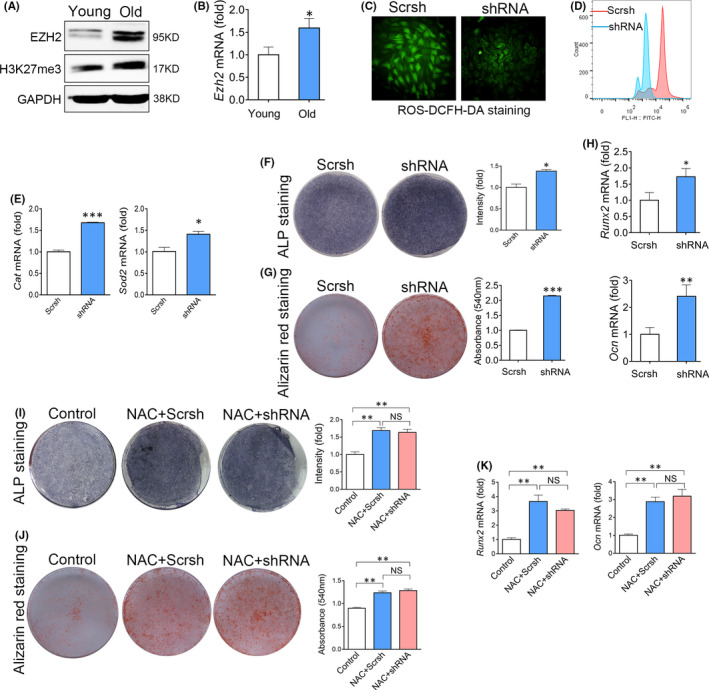
FIGURE 3.

Enhancer of Zeste Homolog 2 enhances oxidative stress to suppress the osteogenic differentiation of BMSCs. (A) Western blot analysis of EZH2 and H3K27me3 levels in young or old BMSCs. (B) Real‐time RT‐PCR analysis of Ezh2 expression in young or old BMSCs. n=3. (t test) (C) Fluorescence analysis of ROS levels in BMSCs transfected with scrambled shRNA (Scrsh) or EZH2 targeting shRNA for 48hr. (D) Flow cytometry of ROS levels in BMSCs transfected with EZH2 shRNA or Scrsh. (E) Real‐time RT‐PCR analysis of Cat and Sod2 expression in BMSCs transfected with EZH2 shRNA or Scrsh. n = 3. (t test) (F) Alp staining of BMSCs transfected with EZH2 shRNA or Scrsh after 7 days of osteogenic induction. n = 3. (t test) (G) Alp staining of BMSCs transfected with EZH2 shRNA or Scrsh after 7 days of osteogenic induction. n = 3. (t test) (H) Real‐time RT‐PCR analysis of mRNA levels of Runx2 and Ocn in BMSCs transfected with EZH2 shRNA or Scrsh. n = 3. (t test) (I) ALP staining of BMSCs transfected with EZH2 shRNA or Scrsh after treating with NAC. n = 3. (ANOVA) (J) Alizarin red staining of BMSCs transfected with EZH2 shRNA or Scrsh after treating with NAC. n = 3. (ANOVA) (K) Real‐time RT‐PCR analysis of Runx2 and Ocn expression in BMSCs transfected with EZH2 shRNA or Scrsh after treating with NAC. n =3. (ANOVA) Data are shown as mean ± SD. *p < 0.05, **p < 0.01, ***p < 0.001. NS, no significance
