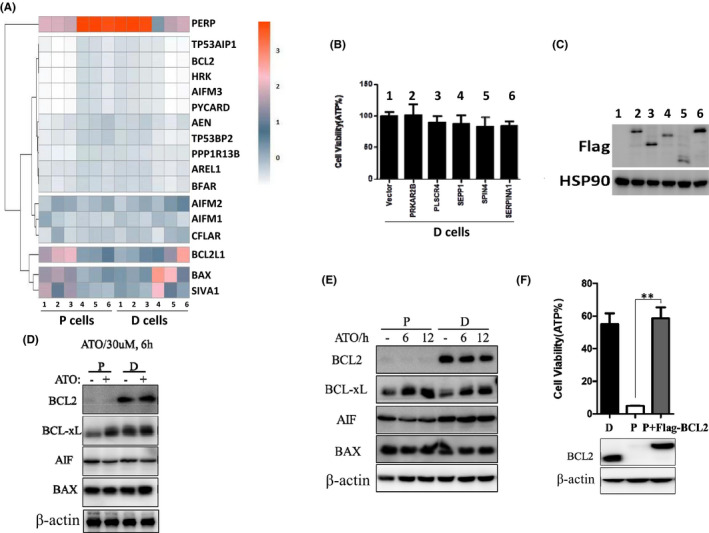
FIGURE 3.

Bcl‐2 controls the ATO resistance in D cells. (A) Microarry analysis of different cell lines. Heatmap of genes upregulated or downregulated in different cell lines was shown. (B) D cells were transfected with indicated genes decreased, then these cells were treated with 10 µM ATO for 24 h, and the cell variability was measured by ATP level. (C) Western blotting was used to detect indicated protein in the cells as shown in (B). (D) P cells and D cells were treated with or without 30 µM ATO for 6 h, and the cells were lysed and immunoblotted with indicated antibodies. (E) P cells and D cells were treated with or without 10 µM ATO for 6 h and 12 h; then, the cells were lysed and immunoblotted with indicated antibodies. (F) Upper: P cells with or without overexpression of Bcl‐2 and D cells were treated with 10 µM ATO for 24 h. Cell survival was determined by measuring ATP levels. Bottom: The above cells were lysed and immunoblotted with indicated antibodies. **p < 0.01, compared between the P cells and P cells overexpressed Bcl‐2
