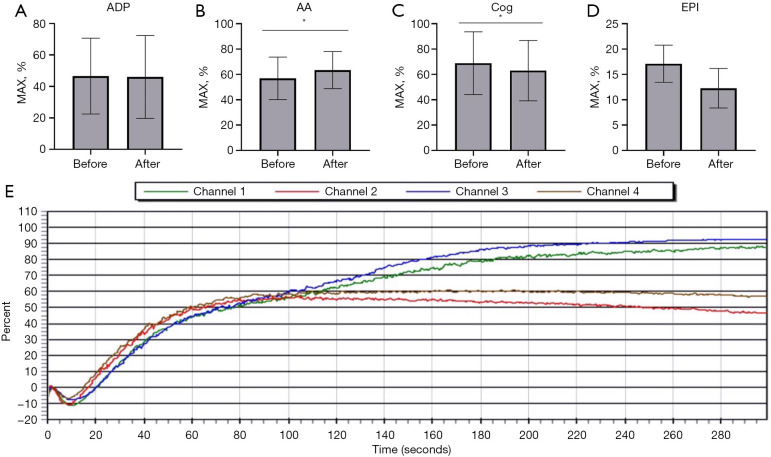
Figure 4.
Platelet aggregation function test. (A) Adenosine diphosphate (ADP) activator. (B) Arachidonic acid (AA) activator. (C) Collagen (Cog) activator. (D) Epinephrine (EPI) activator. (E) Trend diagram before and after 16.9 J/cm2 treatment for 2 samples (before treatment: Channel 1 and Channel 3; after treatment: Channel 2 and Channel 4). The error bars represent standard deviations. Significance of differences from 0 J/cm2 for the corresponding cytokine is indicated by *, P<0.05.

