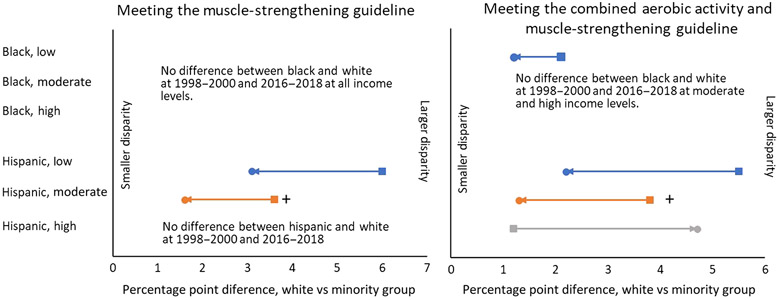
Figure 7 —
Muscle-strengthening guideline and combined guidelines estimates for the differences between non-Hispanic white and non-Hispanic black and non-Hispanic white and Hispanic (Hispanic) adults at low, moderate, and high income levels. Text, not lines, is used where there is no difference between white adults and members of racial/ethnic minority groups from 1998–2000 to 2016–2018. Square indicates difference between white and racial/ethnicity minority groups in 1998–2000. Circle indicates difference between white and racial/ethnic minority groups in 2016–2018. Plus indicates significant narrowing in difference (D1 – D2 > 0; [1998–2000 white – minority] – [2016–2018 white – minority] > 0). D1 indicates the difference in prevalence at the first time period (1998–2000); D2, difference in prevalence at the last time period (2016–2018).

