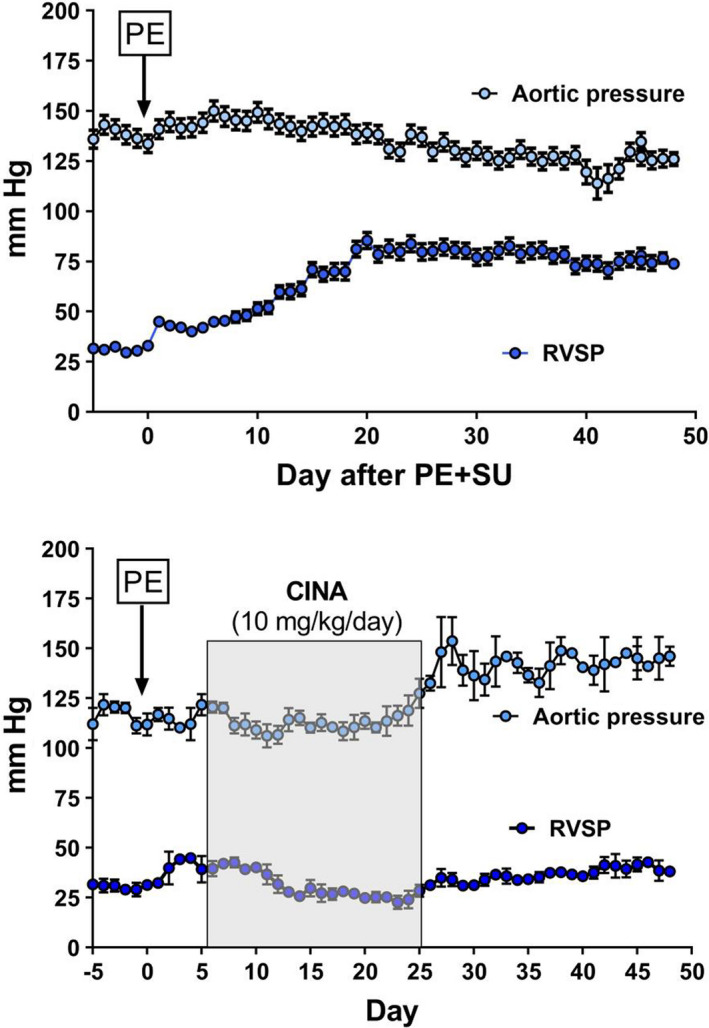
FIGURE 2.

Aortic and right ventricular pressures measured over 50 days in two groups of conscious, freely moving rats, instrumented with telemetrically connected micromanometers. The top panel shows the effect of PE+SU5416 (marked by PE in box) without further treatment (n = 3). The bottom panel shows the effect of PE+SU5416, followed 7 days later by 10 mg/kg/day of cinaciguat, injected subcutaneously daily (n = 3). The data show the mean of 1 min of monitoring, taken at approximately noon each day (x‐axis)
