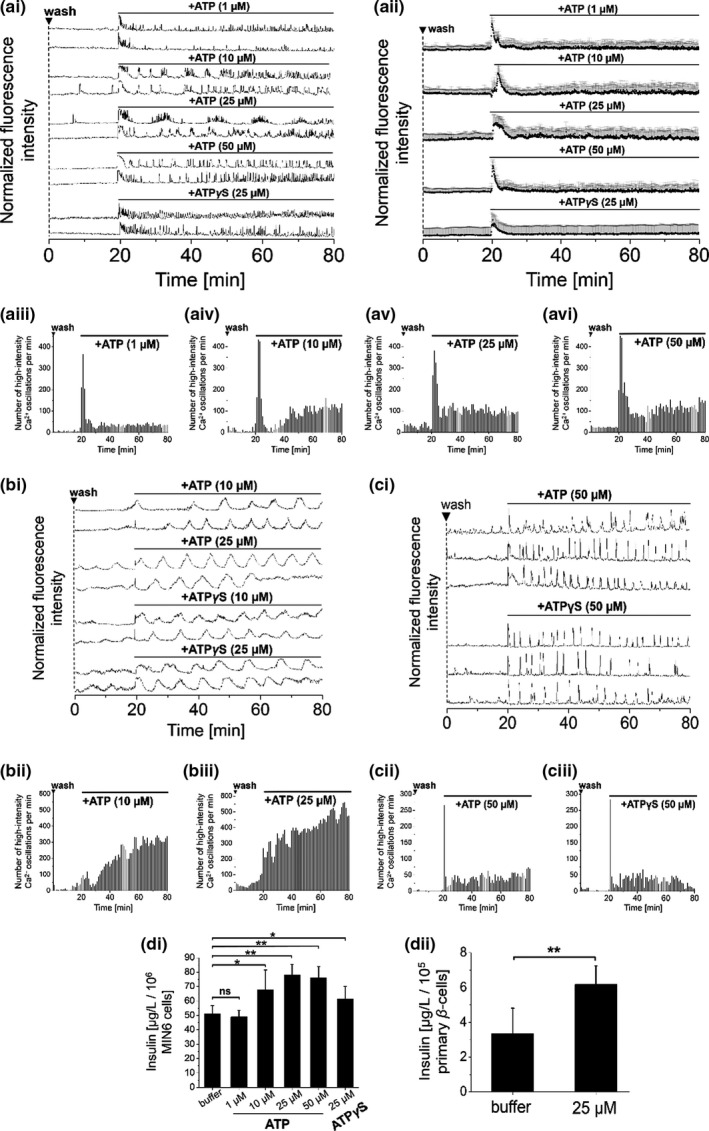
FIGURE 1.

Addition of ATP‐stimulated [Ca2+]i oscillations and insulin secretion in β‐cell lines and primary β‐cells. Addition of ATP or adenosine‐5′‐[γ‐thio]triphosphate (ATPγS) to pre‐washed (a) MIN6, (b) mouse primary β‐cells or (c) 1.1B4 cells immediately started [Ca2+]i oscillations in a concentration‐dependent manner (concentrations as indicated). Representative single [Ca2+]i traces of (ai) MIN6, (bi) mouse primary β‐cells and (ci) 1.1B4 cells, recorded with the Ca2+ indicator Fluo‐4. (aii) Averaged [Ca2+]i traces from MIN6 cells. Numbers of detected high‐intensity [Ca2+]i events per 60 s interval from (aiii‐vi) MIN6, (bii+iii) mouse primary β‐cells, and (cii+iii) 1.1B4 cells. (d) Insulin secretion, as determined from (di) MIN6 and (dii) mouse primary β‐cells in the presence of ATP or ATPγS. For [Ca2+]i data, averages of n = 50 MIN6, 1.1B4 and n = 30 mouse primary β‐cells are shown. Imaging experiments were performed in the presence of 11 mM glucose (MIN6 cells and 1.1B4 cells) and 5 mM glucose (mouse primary β‐cells). Washes are indicated by ▼. Insulin measurements were performed in quadruplicate (ANOVA. **p < 0.01, ns = not significant = p > 0.05, with repeated measures as necessary). Error bars present SD
