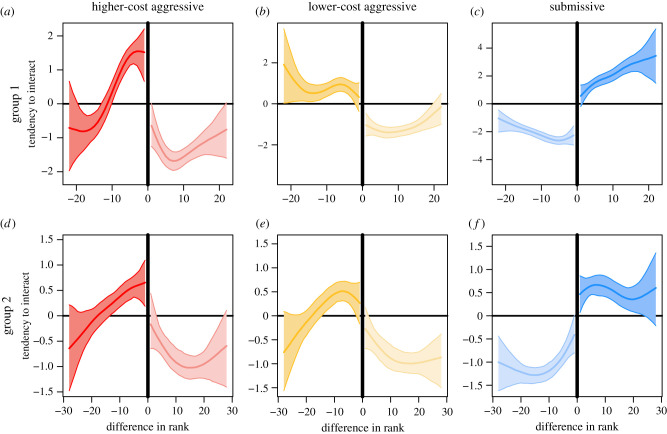
Figure 3.
The tendency to interact in relation to relative hierarchy position for three categories of dominance interactions in males of two vulturine guineafowl social groups. Patterns of tendency to interact inferred separately for higher-cost aggressive (a,d), lower-cost aggressive (b,e) and submissive (c,f) interaction categories for social groups one (a–c) and two (e,f). Each graph shows the median (thick line) tendency to interact and the 95% range (shaded area) of the estimated tendencies (from the repeated data splitting approach described in figure 1) plotted against rank difference. A negative difference in rank signifies interactions aimed at lower ranking individuals and vice versa for a positive difference in rank. The darker side of each graph relates to aggressive and submissive interactions expressed towards lower and higher ranking individuals, respectively, and vice versa for the lighter side of the graph. Note that the absolute values of tendency to interact depend on the number of observed interactions and are thus not comparable across graphs. (Online version in colour.)

