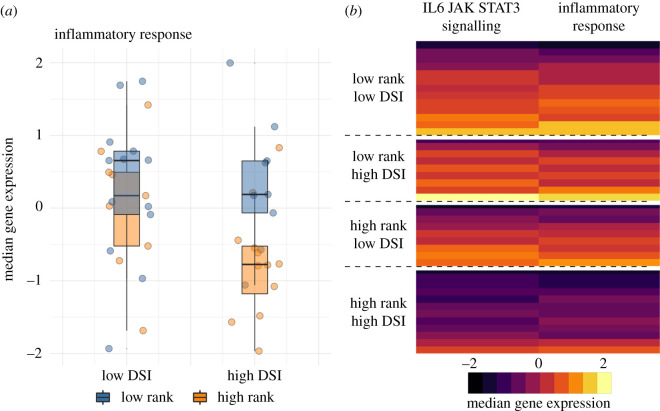
Figure 3.
The gene expression signature of multidimensional social advantage. (a) Median gene expression for genes in the inflammatory response gene set illustrates that high-ranking animals exhibit lower inflammation-related gene expression regardless of social bond strength (main effect of rank = −0.65, p = 0.028). There is no main effect of DSI (p = 0.213), but the difference between high- and low-ranking females is greater when high-ranking females also have strong social bonds. (b) Median, rescaled gene expression levels per individual in the Hallmark IL6 signalling via JAK/STAT3 and the inflammatory response gene sets. Each row represents a different female, with rows stratified by median dominance rank and median DSI. All gene expression values in figure 3 are based on baseline samples. (Online version in colour.)

