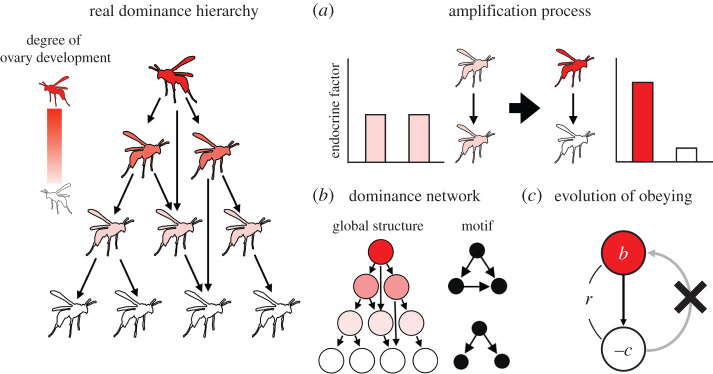
Figure 2.
Build-up of a dominance hierarchy (as represented by the leftmost diagram). The colour scale indicates reproductive ability, with white indicating non-development of ovaries. (a) Amplification of physiological states by dominance behaviour is an example of how changes in individual-level attributes affect ranking in the hierarchy. (b) A dominance hierarchy can be abstracted into a directed network, whose global structure is characterized by several quantitative measures such as motif frequencies. (c) Evolution of costly (–c) obeying, i.e. acceptance of a subordinate position, in dominance interactions requires special explanation. Inclusive fitness benefit (r × b) to the subordinate provides a general solution. Arrows point from actors to recipients of dominance behaviours. (Online version in colour.)

