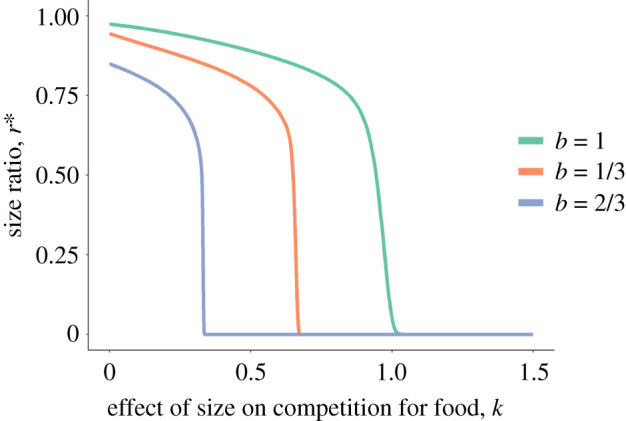
Figure 1.

Bifurcation plots of equilibrium size ratios, r* plotted against the effect of relative size on competition for food, k in Model 1. If k > 0, larger individuals are superior competitors. The lines represent the stable equilibrium point to the model for a given value of k; there is only ever one stable equilibrium point for any value of k. As the value of k increases, the stable equilibrium size ratio shifts from greater than 0 to 0 at k = 1 − b (panel a). Results are plotted for three different values of b, a measure of nonlinearity of the effect of size on growth rate. Other model parameters are: A = 0.05, D = 0.00323, q = 0.05, z = 0.5, C = 0.5, h = 1, u = 1, x = 1, y = 3. (Online version in colour.)
