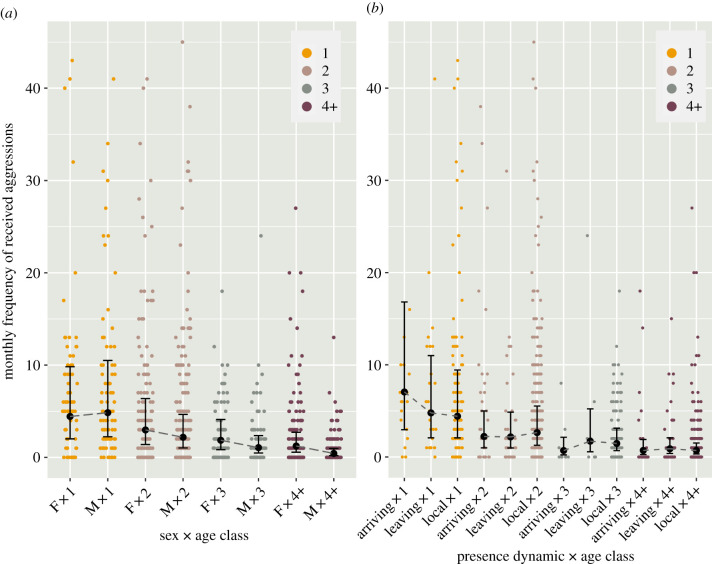
Figure 5.
Modelled effects of the interaction between individuals' (a) sex and age class (1, 2, 3, 4+ i.e. adult), and (b) age and presence dynamic (arriving, leaving, local) on individuals’ monthly frequency of received aggressions (predicted count values), generated with the ‘ggeffect’ function in R package ggeffects [58]. Error bars in (a) and shaded area in (b), respectively, represent 95% confidence intervals around the estimated marginal means. (Online version in colour.)

