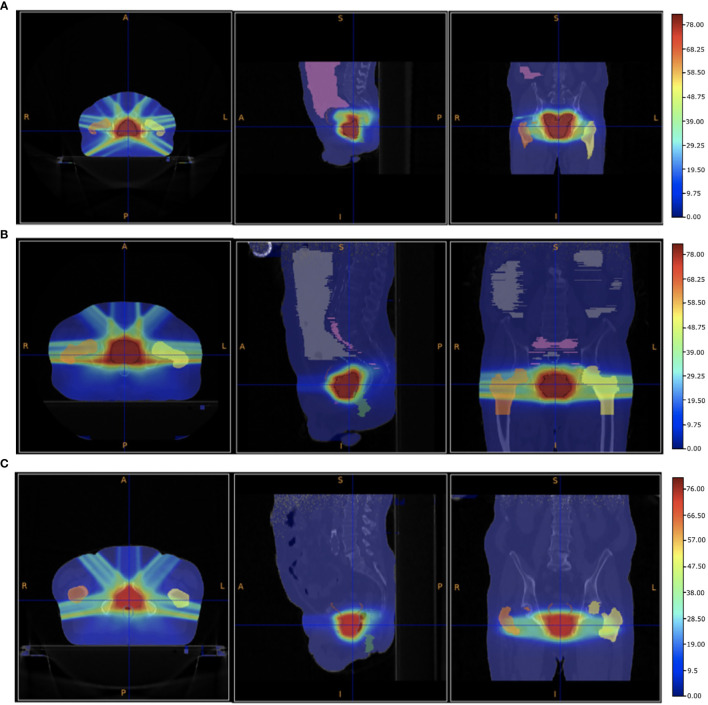
Figure 5.
Patient PZ1 (A), PZ2 (B) and PZ3 (C) CTs overlapped with the biological dose maps optimised using the output of a FLUKA simulation using VHEE with energies listed in Table 1 and a DMF of 1 (no FLASH effect). The OARs are shown: the femurs in yellow and orange, the bladder surface in brown, the rectum surface in dark blue. The PTV is shown in red.

