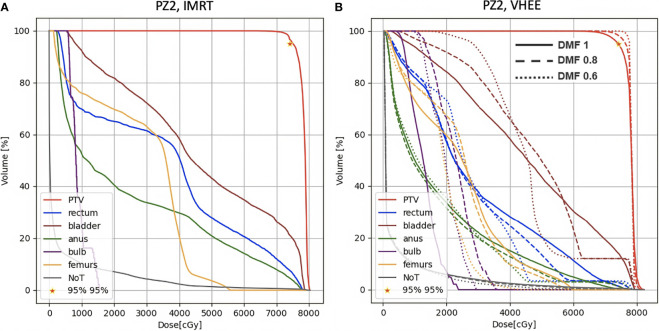
Figure 7.
DVH histograms for the PTV and the OARs of PZ2. The biological dose relative to the normal tissue (NoT) is shown as well. (A) Results obtained with photons (standard IMRT, 5 fields) for the 39 fractions foreseen in the patient treatment (78 Gy in total). (B) Results obtained with electrons of different energies (see Table 1 ) and using different DMF values: the solid line shows results obtained without any FLASH effect, while dashed and dotted lines show the impact of a DMF equal to 0.8 and 0.6 respectively.

