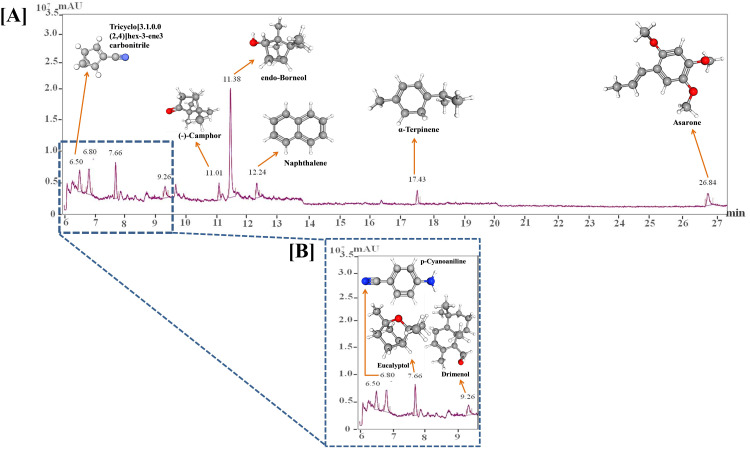
Figure 3.
GC-MS analysis of VD fume. [A] Chromatogram showing the compounds identified in VD fume along with their corresponding retention times (RTs) and chemical structures. [B] A portion of the chromatogram between 6 and 9.5 min has been enlarged to prominently show the peaks of the identified compounds with retention times within this range.

