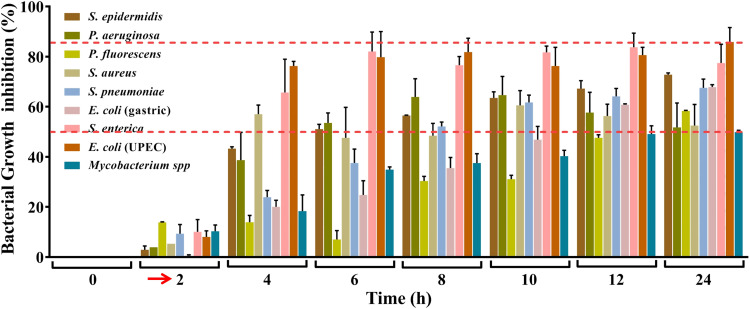
Figure 7.
Comparison between the growth inhibitory effects of VD fume on different pathogenic bacteria. Composite bar graph showing percent growth inhibitions of nine pathogenic bacteria recorded at different time points. Cultures were aerated with VD fume at 2 h which is indicated with red arrow along the X-axis. The overall maxima-minima inhibition range is demarcated with red dashed lines.

