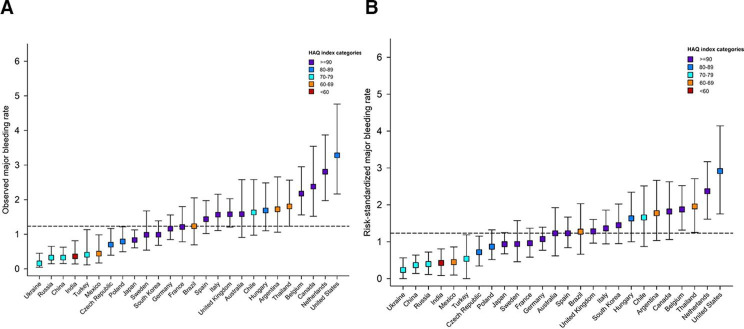
Figure 3.
Observed (A) and risk-standardised1 (B) major bleeding rates by country.1 Computed as the ratio of observed and predicted rate for each country, multiplied by the global observed rate. The predicted rate estimated from a Fine-Gray model with the following covariates: age, sex, type of AF, systolic and diastolic blood pressure, pulse, BMI, hypertension, diabetes, heart failure, history of stroke/TIA/SE, history of bleeding, vascular disease, acute coronary syndromes, moderate to severe CKD, hypercholesterolaemia, cirrhosis, carotid occlusive disease, VTE, dementia, smoking status, heavy alcohol consumption. Cis for risk-standardised rates are calculated through bootstrap sampling with 1000 replications. Showing only countries with more than 700 patients enrolled. Horizontal dashed line represents overall observed global rate. AF, atrial fibrillation; BMI, body mass index; CKD, chronic kidney disease; HAQ, Healthcare Access and Quality; SE, systemic embolism; TIA, transient ischaemic attack; VTE, venous thromboembolism.

