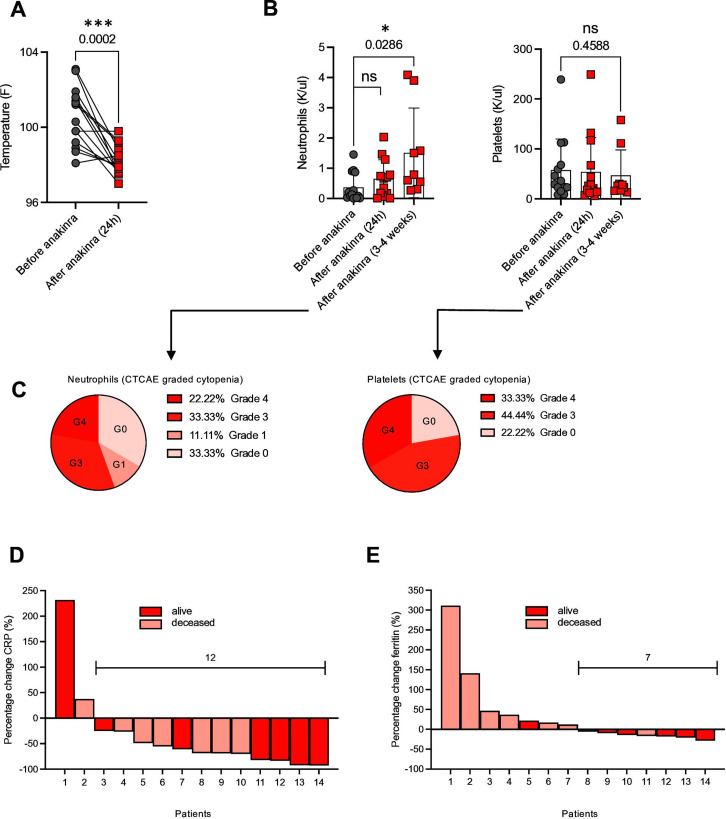
Figure 2.
Temperature and laboratory variables as parameters of toxicity in anakinra-treated patients. (A) Temperature: highest value 24 hours before/after the first/last anakinra dose. (B) Neutrophil and platelet count before and after anakinra. Each dot and square connected by a line indicate one patient, n=14. Temperature: paired t test. Neutrophil count: paired t test. Platelet count: paired t test, p value=0.4588 (ns). Pie charts of neutropenia and thrombopenia 3–4 weeks after anakinra application. Grading (G 0–4) in accordance with the Common Terminology Criteria for Adverse Events (CTCAE) V.5 (C). Waterfall plots of percentage change of CRP (D) and ferritin (E). Each column represents a patient. Inflammatory markers were obtained within the 48 hours before the first dose and after the last anakinra dose. Dark red indicates patients alive at the time of data cut. Light red indicates patients deceased. Statistical analysis was performed using GraphPad Prism V.9.0 (GraphPad software, LLC). *P=0.0286, ***P=0.0002. CRP, C reactive protein; ns, not significant.

