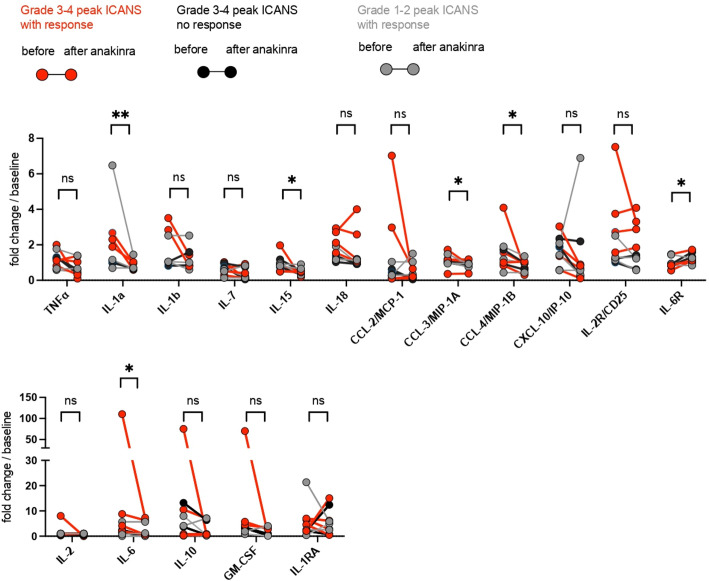
Figure 3.
Analysis of inflammatory cytokines before and after anakinra application. Analysis of cytokines in patient’s serum before and after anakinra application. Samples were collected within 1–2 days (median 1 day) before and 2–8 days (median 4 days) after the last anakinra dose (corresponding to days 3, 7, 14, 21, and 28 after CART infusion). (A) The custom 27-plex Luminex assay panel was used. Each dot connected by a line indicates one patient. Peak ICANS grades 3–4 with subsequent neurotoxicity reduction (response) are indicated by red circles. Peak ICANS grades 3–4 without subsequent neurotoxicity reduction (no response) are indicated by black circles. Grade 1–2 ICANS are indicated by gray circles, n=9. Ratio paired t-test. Statistical analysis was performed using GraphPad Prism V.9.0 (GraphPad Software, LLC.). *P<0.05, **P<0.01. ICANS, immune effector cell-associated neurotoxicity syndrome; ns, not significant.

