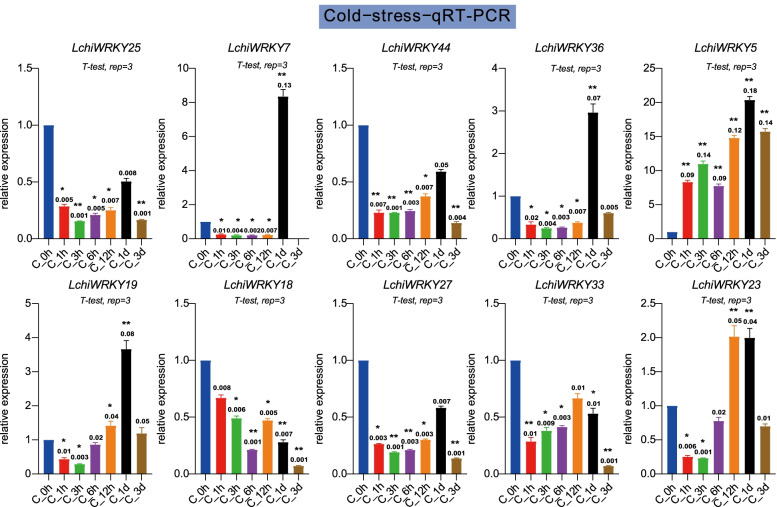
Fig. 11.
qRT-PCR verification of the cold stress response of 10 LchiWRKYs. Expression analysis of LchiWRKYs under cold stress conditions, determined by qRT-PCR. The Y-axis indicates the relative expression level and the X-axis represents different time points after stress treatment taken for expression analysis; the mean ± standard error measurement (SEM) value with three replications (n = 3) is displayed. Each time point was compared to the control group, T-tests were used to calculate significance: * indicates p < 0.05, and ** indicates p < 0.01

