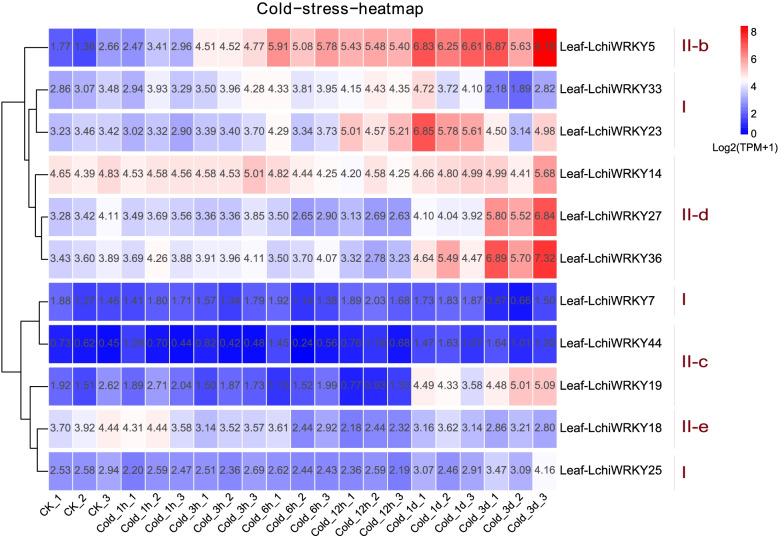
Fig. 8.
LchiWRKY expression patterns in response to cold stress. Expression levels of LchiWRKYs at successive time points in response to cold stress. CK_1, CK_2, CK_3 represent three biological repetitions of the control group, Cold_1h, Cold_3h, Cold_6h, Cold_12h, Cold_1d, Cold_3d represent three biological repetitions of each time point (1 h, 3 h, 6 h, 12 h, 1d, 3d), Leaf-LchiWRKYs represent LchiWRKY gene of leaf tissue. The transcript abundance level was normalized and hierarchically clustered by using log2(TPM + 1) values. Colored blocks indicate decreased (blue) or increased (red) transcript accumulation among the analyzed tissues. The heat map was generated by the R package pheatmap (v1.0.12)

