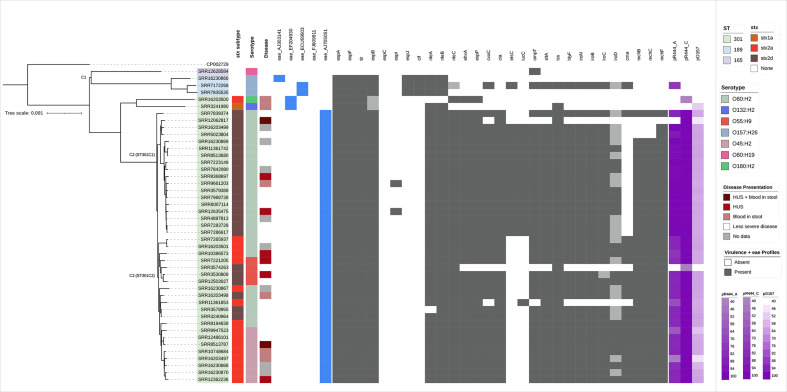
Fig. 2.
Population structure of CC165 in the UK (n=46) (three isolates excluded), constructed using SnapperDB and IQTree, and rooted at the midpoint. Sequence type, stx subtypes, severe clinical diagnosis and serotype are the first four colour strips mapped onto the phylogeny. The presence of variants of the eae gene is shown as blue for detected and white for not detected. VF profiles achieved from PHE pipelines supplemented with genes from CGE are annotated on the population structure of CC165 in the UK. Dark grey indicates detection, whereas light grey indicates the gene was not detected but coverage and homology values are high (>60). Purple on the right of the VF annotation indicates identity coverage of isolates to the three plasmid references, pR444_A, pR444_C and pO157. Shades of purple indicate coverage identity values, with light purple being 40.

