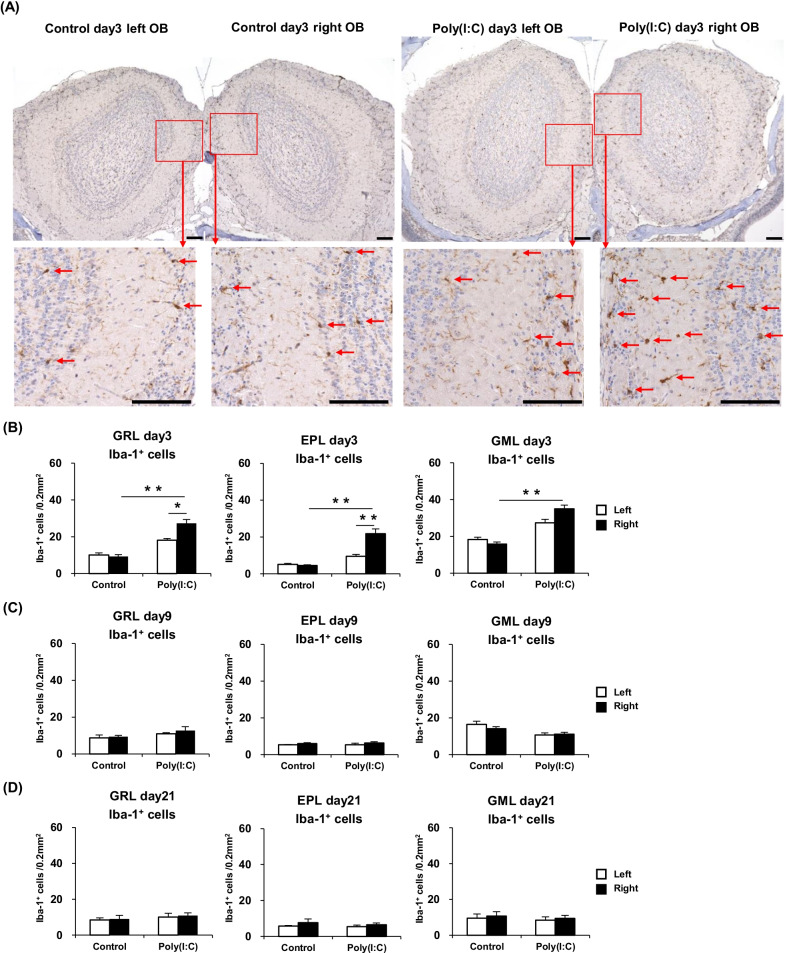
Fig. 4.
A Immunostained sections, showing the microglia/macrophages in the OB of the Control day 3 and Poly(I:C) day 3 groups (Scale bar = 100 μm). B Comparison of the Iba-1+ cell counts at day 3 in the GML, GRL, and EPL between the groups. C Comparison of the Iba-1+ cell counts at day 9 in the three described areas between the groups. D Comparison of the Iba-1+ cell counts at day 21 in the three described areas between the groups. Statistical analysis was performed using the Mann–Whitney U test, with P < 0.05 (*) and P < 0.01 (**) representing statistical significance. The error bars shown represent the standard error of the mean (n = 5). EPL external plexiform layer, GML glomerular layer, GRL granule layer, OB olfactory bulb, OSNs olfactory sensory neurons; Poly(I:C) polyinosinic–polycytidylic acid

