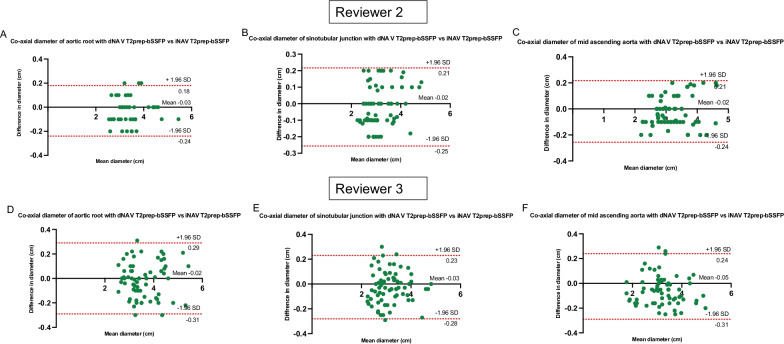
Fig. 6.
Bland–Altman plots for co-axial aortic dimensions between the dNAV and the iNAV T2prepared-bSSFP. Bland–Altman plots for co-axial diameter measurements of the aortic root, sinotubular unction and mid ascending aorta between the dNAV and the iNAV T2prepared-bSSFP sequence for reviewer 2 (A–C) and reviewer 3 (D–F). The black line indicates the mean bias of the diameter measurements whereas the red lines represent the 95% confidence interval. Values are given in cm. A Good agreement with a mean difference between methods of − 0.03 cm for reviewer 2 for the aortic root (95% CI − 0.24 to 0.18); B good agreement with a mean difference of − 0.02 cm for reviewer 2 for the sinotubular junction (95% CI − 0.25 to 0.21); C good agreement with a mean difference of − 0.02 cm for reviewer 2 for the mid ascending aorta (95% CI − 0.24 to 0.21); D good agreement with a mean difference of − 0.02 cm for reviewer 3 for the aortic root (95% CI − 0.31 to 0.29); E good agreement with a mean difference of − 0.03 cm for the sinotubular junction for reviewer 3 (95% CI − 0.28 to 0.23); F good agreement with a mean difference of − 0.05 cm for reviewer 3 for the mid ascending aorta (95% CI − 0.31 to 0.24)

