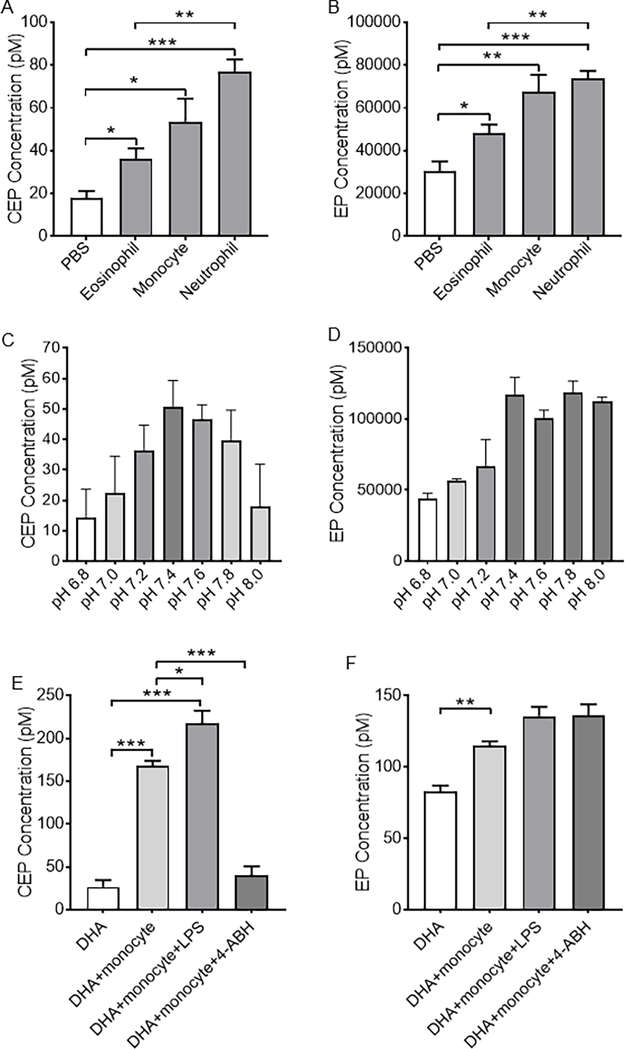
Figure 2. CEP, but not EP, is generated by pro-inflammatory myeloid cells in a MPO-dependent manner.
A and B. Bar graphs showing production of CEP (A) and EP (B) by different human blood leukocytes. C and D. CEP (C) and EP (D) production by human neutrophils in different pH values. Note the highest amount of CEP and EP production is achieved at the normal physiological pH = 7.4. E and F. Bar graphs showing CEP (E) and EP (F) production from DHA by human monocytes with or without LPS stimulation or 4-ABH inhibition. LPS, lipopolysaccharide. 4-AHB, 4-aminobenzoic acid hydrazide. All data are mean ± s.e.m. Unpaired two-tailed t-test were used to determine statistical significance. * p < 0.05, ** p < 0.01, and *** p < 0.001.

