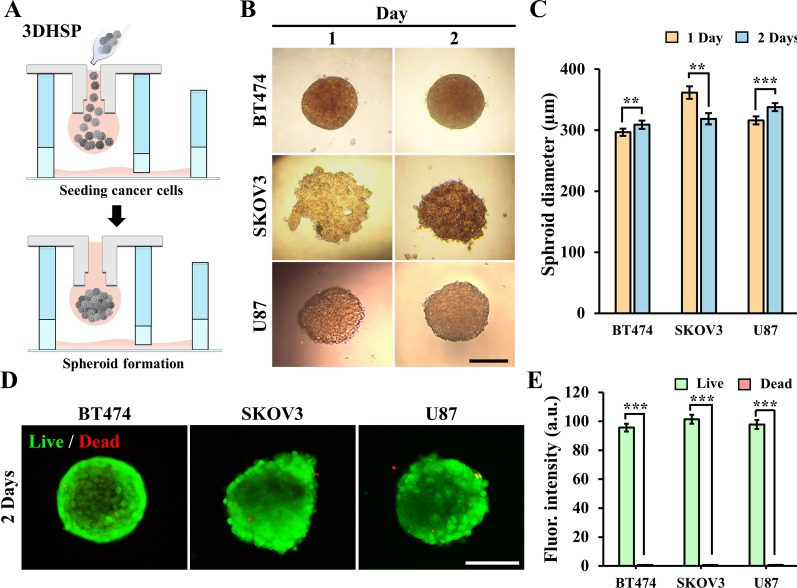
Fig. 4.
Characterization of tumor spheroids generation in the 3DHSP. A Schematic describing spheroid generation in the 3DHSP. B Optical images of BT474, SKOV3, and U87 spheroids in the 3DHSP for 1 and 2 d. Scale bar: 200 μm. C Size of the spheroids after 1 and 2 d. D Representative fluorescent images of three kinds of tumor spheroids for 2 d, showing the live (green) and dead (red) cells. E Fluorescence intensity of live/dead cells in three types of tumor spheroids for 2 d (n ≥ 10). Student’s t-test: **p < 0.01, ***p < 0.001. Scale bar: 200 μm

