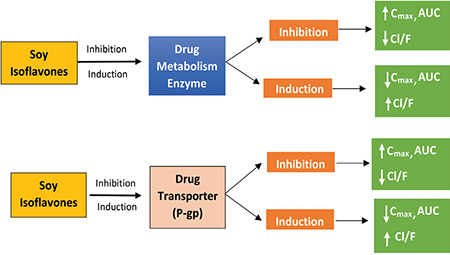
Figure 2.

Mechanisms of pharmacokinetic interactions between drugs and soy isoflavones (based on Table 4)
Cmax: Maximum concentration, AUC: Area under the curve, P-gp: P-glycoprotein, CL/F: Oral clearance

Mechanisms of pharmacokinetic interactions between drugs and soy isoflavones (based on Table 4)
Cmax: Maximum concentration, AUC: Area under the curve, P-gp: P-glycoprotein, CL/F: Oral clearance