
Extended Data Figure 8 |. Properties of LEC dopamine inputs.
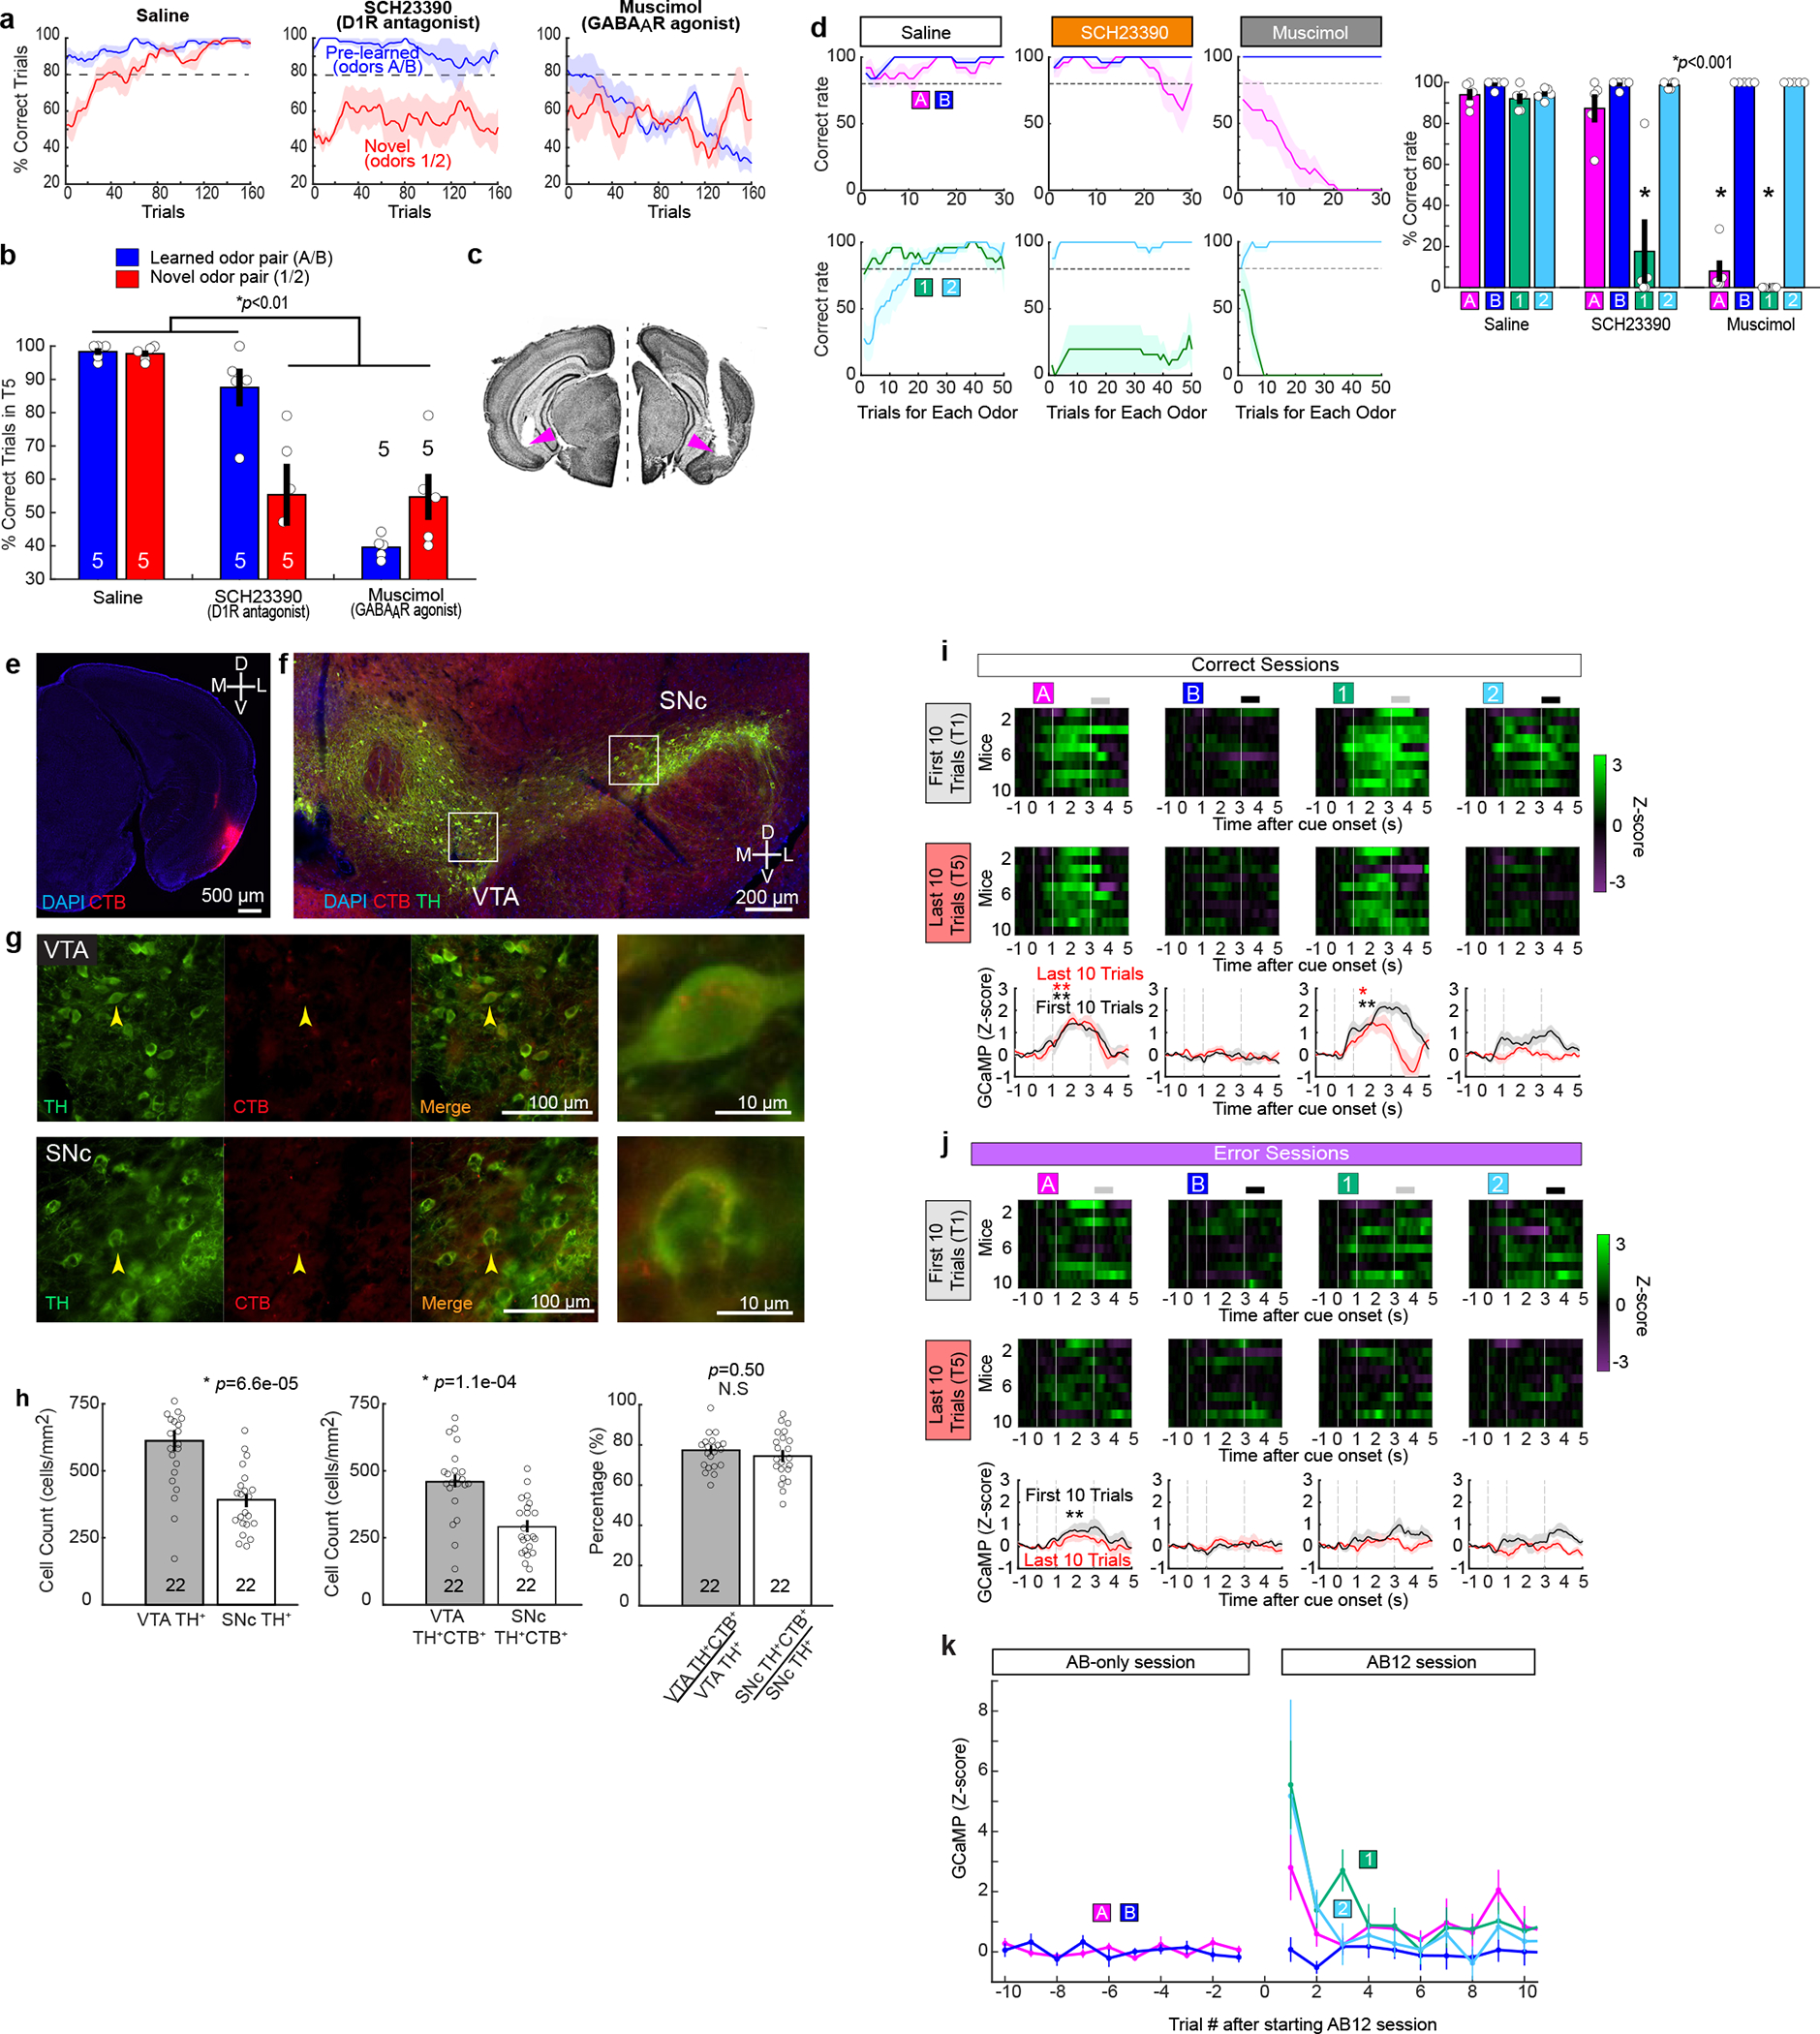
a-d, Pharmacological blockade experiments during associative learning. We performed a supplementary pharmacological experiment to validate the optogenetic inhibition experiments using dopamine D1 receptor antagonist SCH23390, or GABAA receptor agonist muscimol. SCH23390 bilateral injection abolished new learning of Odor-1 and Odor-2, while sparing the pre-learned association, replicating the result obtained from the optogenetic inhibition of dopamine fibers (Fig. 3e). Injection of muscimol impaired both the pre-learned association and acquisition of new association, implying an involvement of LEC neurons other than fan cells in the retrieval of pre-learned association.
(a) Learning curves during saline, SCH23390 and muscimol infusions.
(b) Percent correct sessions during trials 121 – 160 where mice correctly learned new association (p=6.1e-4, ANOVA; 0.0032 or better, post-hoc Tukey test; n = 5 mice)
(c) Example histology from cannula implantations.
(d) Learning curves during saline (left), SCH23390 (middle) and muscimol (right) sessions. In these plots, the data shown in (a) were plotted for percent correct trials in each odor trial type as a function of trial number for each odor type. (Right) Performance of mice in the last 10 trials (p=1.3e-15, ANOVA; p = 2.2e-7, post-hoc Tukey test; n = 5 mice).
e-h, Retrograde tracing of LEC dopaminergic fibers from VTA and SNc
(e) Coronal section of the right hemisphere including LEC, where the retrograde tracer cholera toxin B (CTB, red) was injected.
(f) Coronal section of the right hemisphere midbrain including VTA and SNc. Anti-tyrosine hydroxylase (TH, green) immunostaining reveals dopaminergic cells.
(g) Magnified windows from (f). Yellow arrows point to example cells expressing both TH and CTB, which are further magnified in the rightmost panels.
(h) From left, density of TH-expressing neurons in VTA and SNc, TH+CTB+ population between VTA and SNc, percentage of double-positive neurons among TH+ neurons. Although VTA has more cells for both TH+ and TH+CTB+ neurons (p<0.001, Wilcoxon rank sum test), the percentage of CTB+ neurons did not differ between VTA and SNc (p=0.50, Wilcoxon rank sum test; n = 22 sections obtained from n = 3 mice).
i-k, Calcium imaging of dopamine inputs.
(i) Calcium signals from individual hemisphere (n=10) during first 10 trials (T1, top) and last 10 trials (middle, T5) in correct sessions. Mean traces are shown at the bottom for T1 (black) and T5 (red). *p<0.05 and **p<0.01, Wilcoxon signed-rank test during 0.5 – 3 s after cue onset compared with 1-s pre-cue period.
(j) Same as (b), but for error sessions.
(k) Plot of GCaMP calcium signal as a function of trial number after starting AB12 session (n=10 hemispheres).