
Extended Data Figure 2 |. Performance of mice during associative learning.
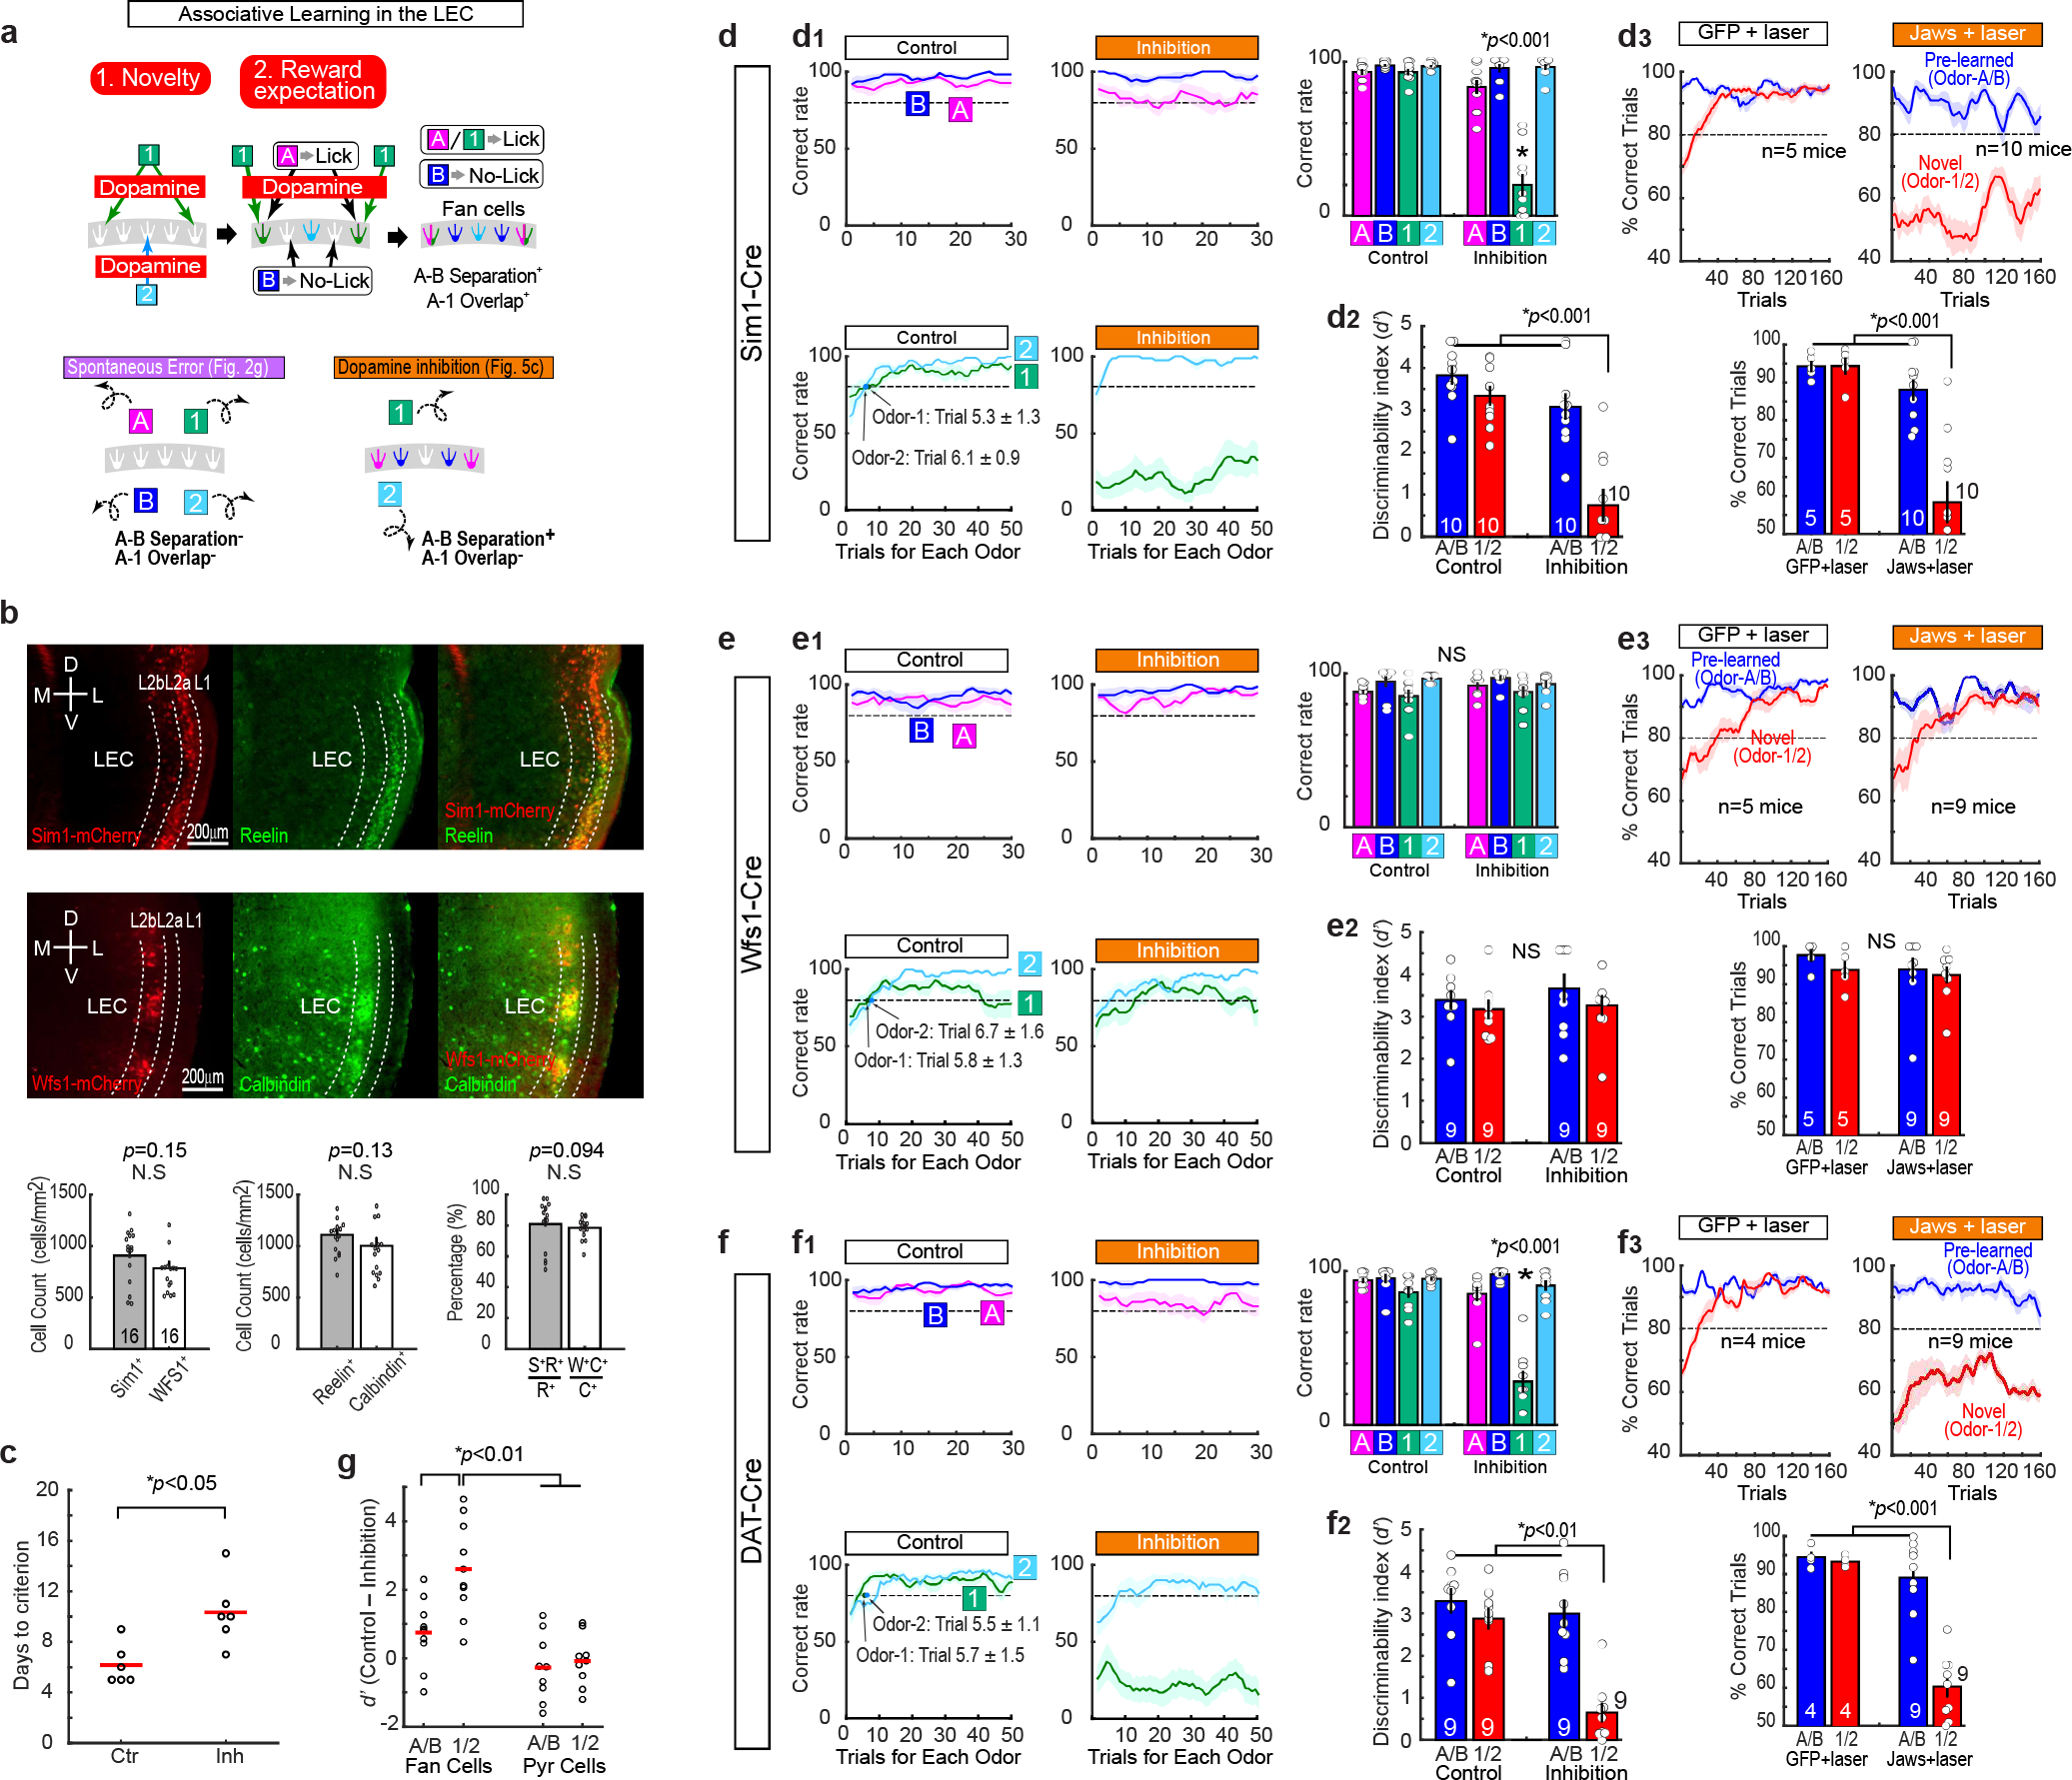
(a) A model for LEC dopamine and fan cells in associative learning. When novel cues are presented, LEC dopamine functions as a “detonator” of fan cell activity. Dopamine gradually supplies reward expectation signals only during rewarded Odor-A and Odor-1 trials, serving as a supervising signal so that Odor-A and Odor-1 are represented in the same fan cell population. Odor-B is represented by a fan cell population distinct from Odors-A/1, resulting in A-B separation. Novel unrewarded Odor-2 was not clearly represented in our recorded population. Two types of errors were observed in our study: The spontaneous error where A-B separation and A-1 overlap were both abolished (Fig.2g), and the error observed in the unilateral dopamine inhibition sessions where A-B separation was spared but A-1 overlap was abolished (Fig. 4c).
(b) Sim1 and Wfs1 population counts in the LEC. (Top) Reelin immunohistochemistry in Sim1-Cre mice injected with AAV-DIO-mCherry. D, dorsal, V, ventral, M, medial, L, lateral. (Middle) Calbindin immunohistochemistry in Wfs1-Cre mice injected with AAV-DIO-mCherry. (Bottom) From left, density of mCherry-positive neurons in Sim1-Cre and Wfs1-Cre mice, Reelin and Calbindin positive cells, and percentage of mCherry-labeled neurons. (p>0.05, Wilcoxon rank sum test; n = 16 sections obtained from n = 2 mice for each group).
(c) We performed an additional experiment to inhibit fan cells during the whole period of pre-learning with Odor-A and Odor-B (these animals are not included in the data in the main figures). After injecting Jaws in Sim1-Cre mice, A/B training was repeated (n = 6 GFP control mice and n = 6 Jaws inhibition mice). Days until animals reached criterion (three consecutive days of reaching 80%) were compared (p = 0.012, Wilcoxon rank sum test).
(d) Detailed performance of mice during fan cell inhibition.
(d1) Learning curves during control (left) and fan cell inhibition (middle) sessions. In these plots, the data shown in Fig. 1d were plotted for percent correct trials in each odor trial type as a function of trial number for each odor type. (Right) Performance of mice in the last 10 trials (p=6.1e-19, ANOVA; p= 6.0e-8, post-hoc Tukey test; n = 10 mice).
(d2) Performance of mice in trials 121–160 as in Fig. 1d, but assessed with discriminability index (D-prime) (p=3.1e-3, ANOVA; p= 1.2e-5 or better, post-hoc Tukey test; n = 10 mice).
(d3) We performed control experiment using Sim1-Cre mice injected with AAV-flex-GFP with laser (n = 5 mice). The GFP control experiment showed same result as no-laser control in Fig. 1d (p=0.0028, ANOVA; p= 3.1e-5 or better, post-hoc Tukey test; n = 5 GFP control mice; n = 10 Jaws inhibition mice).
(e) Same as (d), but for pyramidal cell inhibition in Wfs1-Cre mice in Fig. 2e (p>0.05, ANOVA; n = 5 GFP control mice; n = 9 Jaws inhibition mice).
(g) Same as (d), but for bilateral dopamine inhibition in DAT-Cre mice in Fig. 3e (p=0.0017, ANOVA; p= 2.0e-5 or better, post-hoc Tukey test; n = 4 GFP control mice; n = 9 Jaws inhibition mice).
(f) Difference of percent correct sessions between control and inhibition as in Fig. 1f, but plotted for discriminability index (D-prime) (p=0.019, ANOVA; p= 0.0021 or better, post-hoc Tukey test).