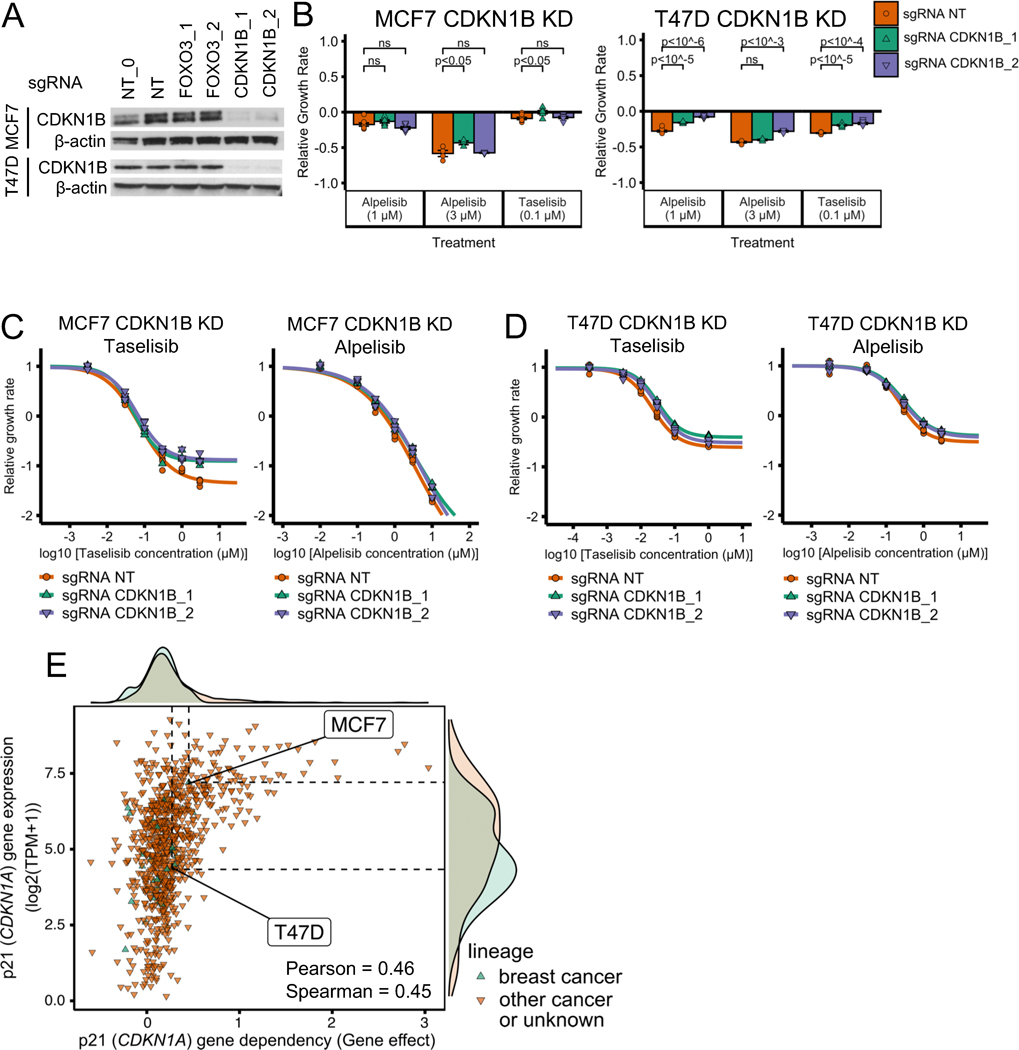
Fig. 5. CDKN1B (p27) knockdown does not have a strong effect on PI3Kα inhibitor sensitivity in ER+ breast cancer cell line models.
(A) Stable cell lines were generated using CDKN1B CRISPR knockdown and showed reduced proteins levels of CDKN1B. NT and NT_0 are two distinct non-targeting control guides. CDKN1B_1 and CDKN1B_2 are two distinct guides targeting CDKN1B. NT, NT_0, FOXO3_1, and FOXO3_2 are the same guides as in Fig. 4. The experiment and samples from Figs. 4A and 5A are the same, thus, so are the β-actin blots. In Fig. 4A we show part of the blot, while in Fig. 5A we show the full blot. (B-D) CDKN1B knockdown does not strongly reduce sensitivity to PI3Kα inhibitors alpelisib and taselisib in ER+ breast cancer cell lines MCF7 and T47D. The same experimental procedures and methods as in panels B-D of Fig. 4 were used for panels B-D of this figure. (E) Sensitivity to p21 (CDKN1A) knockout in CRISPR/Cas-9 loss-of-function screens (DepMap) is strongly correlated with p21 gene expression. Sensitivity to gene knockout is measured using gene effect, which is such that gene effect=0 means no effect and gene effect=−1 is the median effect of known common essential genes.

