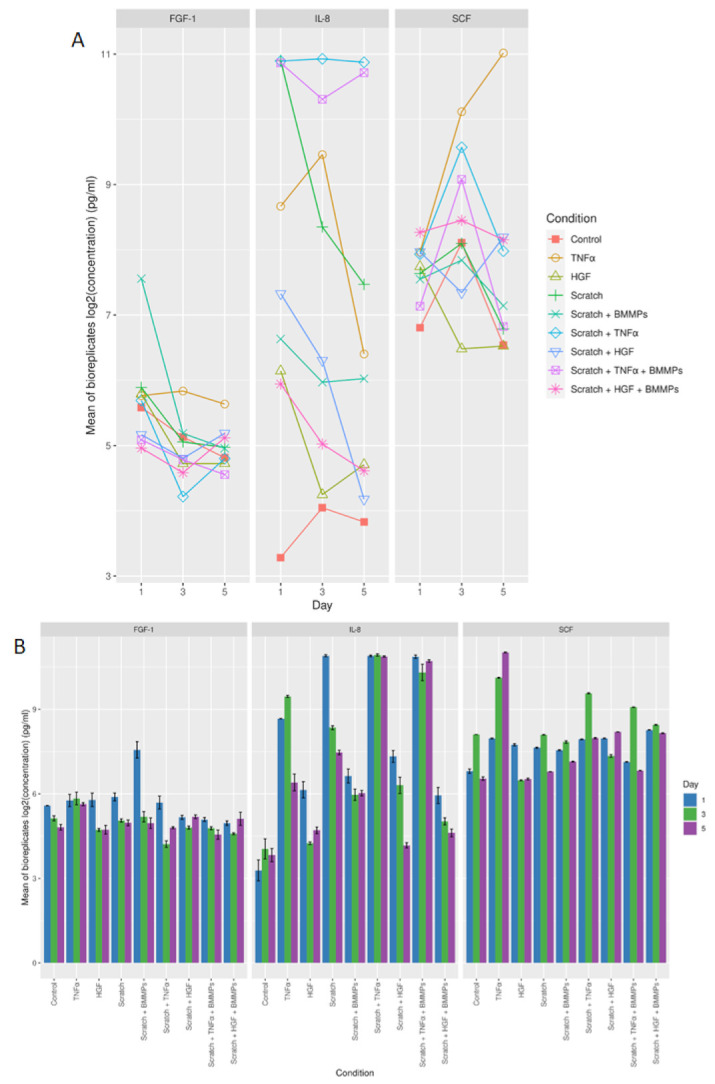
Figure 6.

(A) Log2 concentration in pg/mL (mean of biological replicates) for FGF-1, IL-8, and SCF protein for all the different conditions and time points. (B) Bar graph showing the log2 mean of biological replicates for FGF-1, IL-8, and SCF protein for all the different conditions on day one, day three, and day five.
