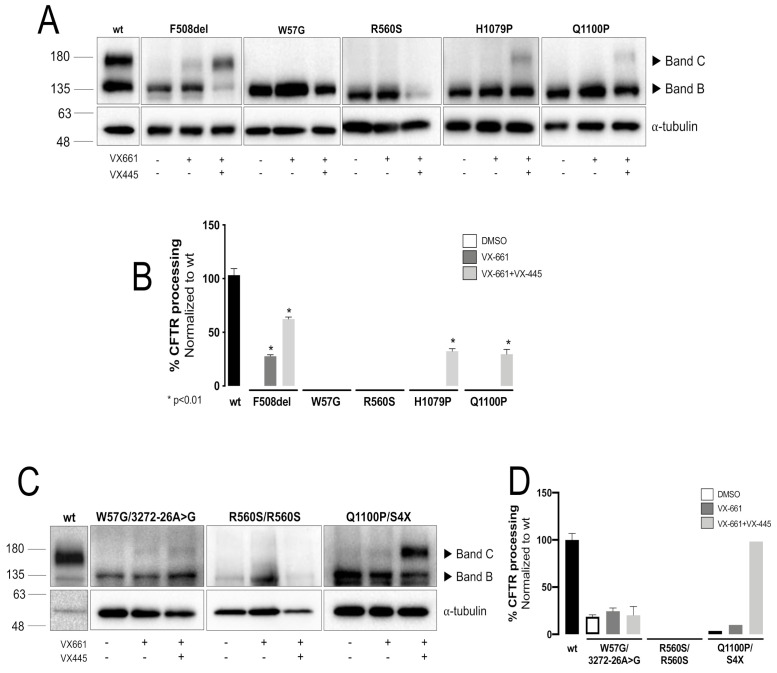
Figure 1.
CFTR expression and effect of CFTR modulators. Representative WB analysis of CFBE cells (A) and organoids (C) expressing F508del-, W57G-, R560S-, H1079P- and Q1100P-CFTR, following incubation with DMSO 0.1% (v/v), VX-661 (5 μM) alone or in combination with VX-445 (3 μM) for 24h (n = 3). (B,D) For each condition densitometry was used to calculate the percentage of mature CFTR (Band C/Band B + Band C). Data were normalized to the efficiency of processing of wt-CFTR and is shown as mean ± SEM. Asterisks indicate significant difference compared with DMSO (p-value < 0.05, unpaired t test). Images were acquired using ChemiDoc XRS+ imaging system BIO-RAD and further processed by Image Lab 6.0.1 software. *, p-value < 0.05.

