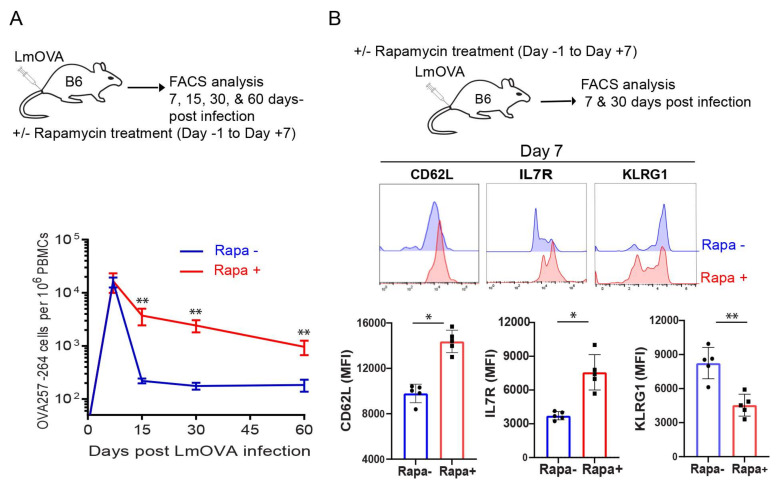
Figure 1.
Rapamycin promotes in vivo CD8+ T-cell survival and memory formation. (A) Schematic diagram of rLmOVA infection in C57BL/6 mice. Mice (n = 5/group) were intravenously injected on day 0 with 2000 CFUs of rLmOVA. Mice were treated with rapamycin from day −1 to day +7. Rapamycin not treated mice received saline and served as controls. Longitudinally tracked kinetics of OVA-specific CD8+ T-cells in blood using flow cytometry. The line graph shows the frequencies of OVA-specific CD8+ T-cells in rapamycin-treated (red) and not treated (blue) groups. (B) Cell phenotype of the OVA-specific CD8+ T-cells in the peripheral blood was analyzed using cell surface memory markers by flow cytometry. Data presented as means ± SEM are representative of two independent experiments with similar results (n = 2–3/group/experiment). * p < 0.05, ** p < 0.01 by two-tailed Student’s t-test.

