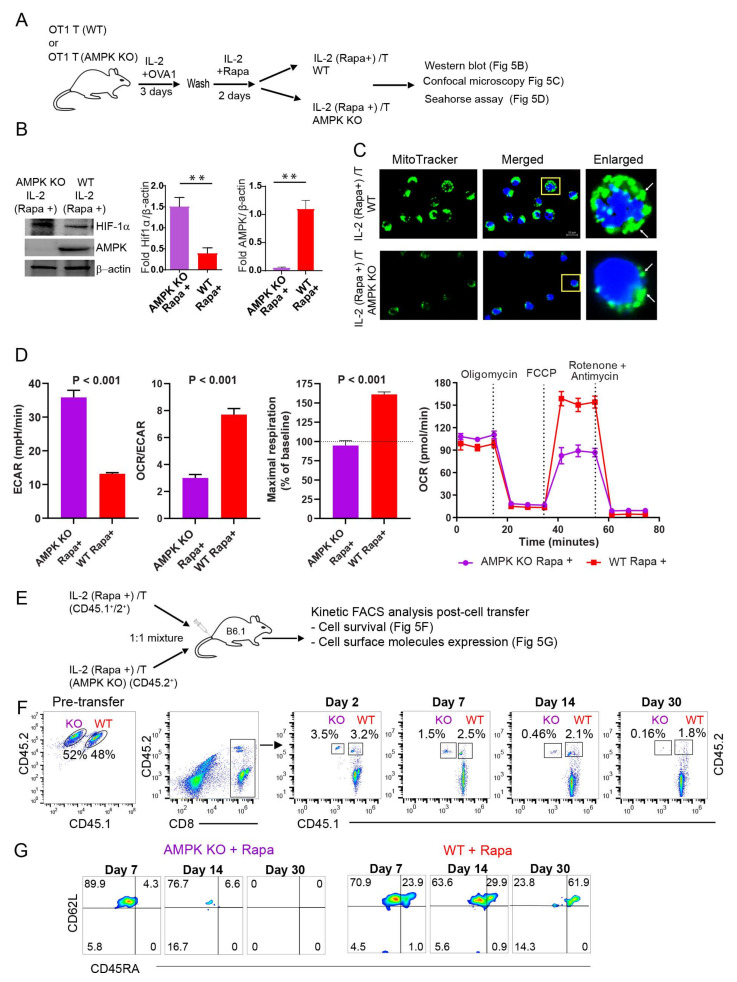
Figure 5.
AMPKα1 deficiency abolishes metabolic AMPKα1 pathway, reduces mitochondrial biogenesis and induces a metabolic switch from FAO to glycolysis in AMPKα1 KO IL-2(Rapa+)/T-cells. (A) Schematic diagram indicates splenic CD8+ T-cell culture for generating rapamycin-treated T-cells from wild-type (WT) and AMPKα1 KO. OVA-specific naïve CD8+ T-cells from the WT OT-1 mice or from AMPKα1 KO mice were activated by 0.1 nM OVAI-peptide in IL-2 containing media for 3 days. Following the wash, activated T-cells were treated with rapamycin (100 nM) in IL-2 containing media for 2 additional days to form IL-2(Rapa+)/TM and AMPK KO IL-2(Rapa+)/TM cells. (B) Cell lysates from IL-2(Rapa+)/TM and AMPK KO IL-2(Rapa+)/TM cells were examined by the Western blot analysis. (C) Confocal microscopy shows mitochondrial mass as indicated by MitoTracker green staining in IL-2(Rapa+)/TM and AMPK KO IL-2(Rapa+)/TM cells. MitoTracker green stained mitochondria (white arrow) and Hoechst stained nucleus (blue). (D) Bar diagrams show basal extracellular acidification rates (ECAR, left bar diagram panel), basal ECAR/OCR ratio (middle bar diagram panel), and maximal oxygen consumption rates (right bar diagram panel; horizontal dotted line indicates a basal OCR, and OCR values above this line is a mitochondrial spare respiratory capacity (SRC) in respective groups; Line diagram shows OCR measured in real-time under basal conditions and in response to indicated mitochondrial inhibitors (red—WT; purple—AMPKα1 KO); p < 0.0001 after FCCP injection. (E) The schematic diagram indicates rapamycin-treated T-cells generated from congenic OT-1 mice using WT mice from CD45.1+/2+ background and AMPKα1 KO from CD45.2+ background. Rapamycin treated wild type (CD45.1+/2+) or rapamycin-treated AMPKα1 KO (CD45.2+) effector T-cells were mixed 1:1 and adoptively transferred into CD45.1 mice. (F) The cell survival kinetics of adoptively transferred WT (CD45.1+/2+) or AMPKα1 KO (CD45.2+) effector T-cells in total host CD8+ T-cells were analyzed longitudinally in peripheral blood by flow cytometry. Flow panels show the relative percentage of rapamycin-treated WT (CD45.1+/2+) or AMPKα1 KO (CD45.2+) effector T-cells post-adoptive transfer (n = 4). (G) Flow panels indicate cell phenotype of rapamycin-treated WT (CD45.1+/2+) or rapamycin-treated AMPKα1 KO (CD45.2+) T-cells at indicated days post-adoptive transfer (n = 4). Data shown are from two to three independent experiments and are presented as means ± SEM (n = 4/group). * p < 0.05, ** p < 0.01, *** p < 0.001 by two-tailed Student’s t-test.

