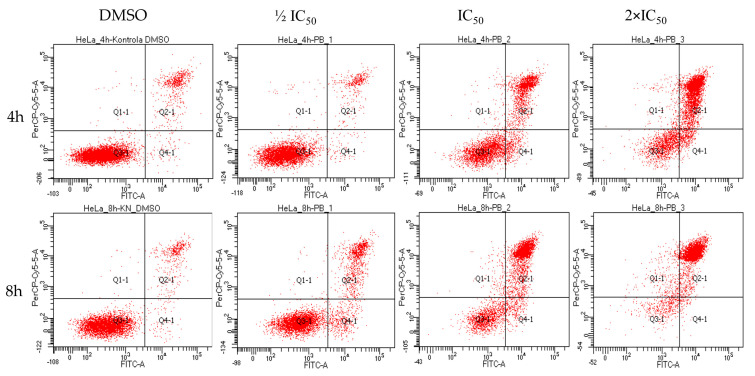
Figure 12.
Representative flow cytograms were obtained by double staining Annexin V (FITC) and propidium iodide (PI). Characteristic time and dose-dependent shift of HeLa cells population from An−PI− (lower left quadrant) to An+PI+ (upper right quadrant) progress through An+PI− state (lower right quadrant) at each cytogram, respectively. Studied concentrations were related to IC50 result of 24 h cytotoxicity assay (1/2 IC50–2.83 µg/mL, IC50–5.66 µg/mL, 2× IC50–11.32 µg/mL, DMSO–0.4%).

