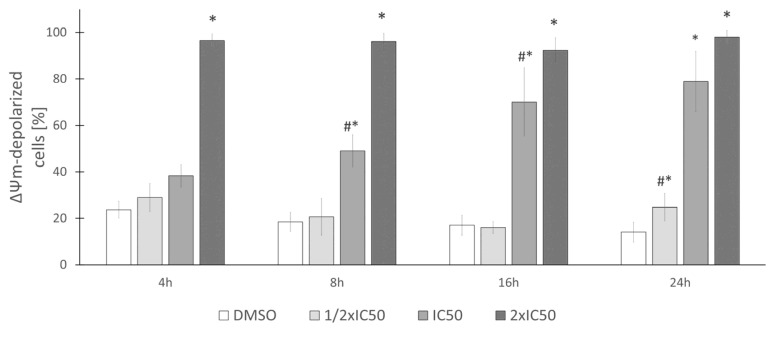
Figure 13.
Rinderol induced alterations in mitochondrial membrane potential expressed as a percent of HeLa cell population with depolarized mitochondrial membrane. Data are the means ± SD of at least three independent replicates. Asterisk (*) indicates statistically significant differences (p ≤ 0.05) between consecutive rinderol concentrations within the same incubation period (DMSO–0.4%, 1/2 IC50–2.83 µg/mL, IC50–5.66 µg/mL, 2× IC50–11.32 µg/mL). Grids (#) indicate results which were significantly different (p ≤ 0.05) in comparison to the previous time point of the same rinderol concentration.

