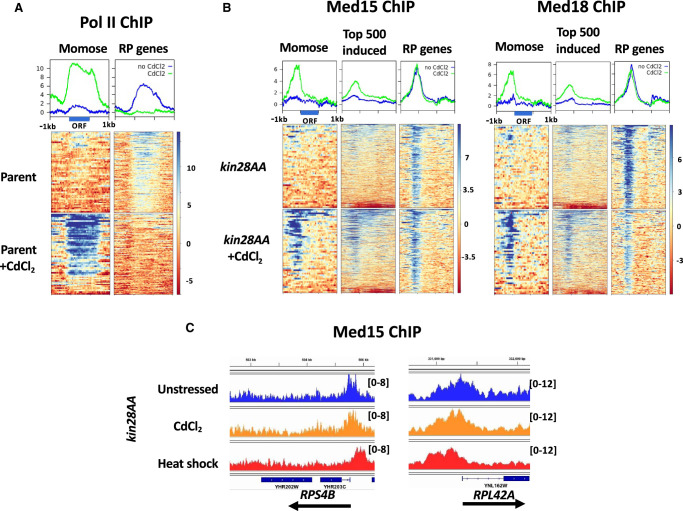
Figure 6.
Effect of CdCl2 exposure on Pol II and Mediator occupancy. (A) Heat maps and line graphs showing normalized occupancy of Pol II at 50 strongly induced genes (Supplemental Table S2; Momose and Iwahashi 2001) and RP genes in the anchor-away parent strain, YFR1321. (B) Heat maps and line graphs showing normalized occupancy by Med15 (tail module) and Med18 (head module) at 50 strongly induced genes, the 500 genes having the highest ratio of induced to uninduced Pol II occupancy, and RP genes. (C) Browser scans showing Med15 occupancy in reads per million mapped reads after Kin28 depletion in unstressed cells, cells exposed to CdCl2, and after 15 min of heat shock, as indicated, at the RPS4B and RPL42A loci. Scale, in reads per million mapped reads, is indicated for each scan.

