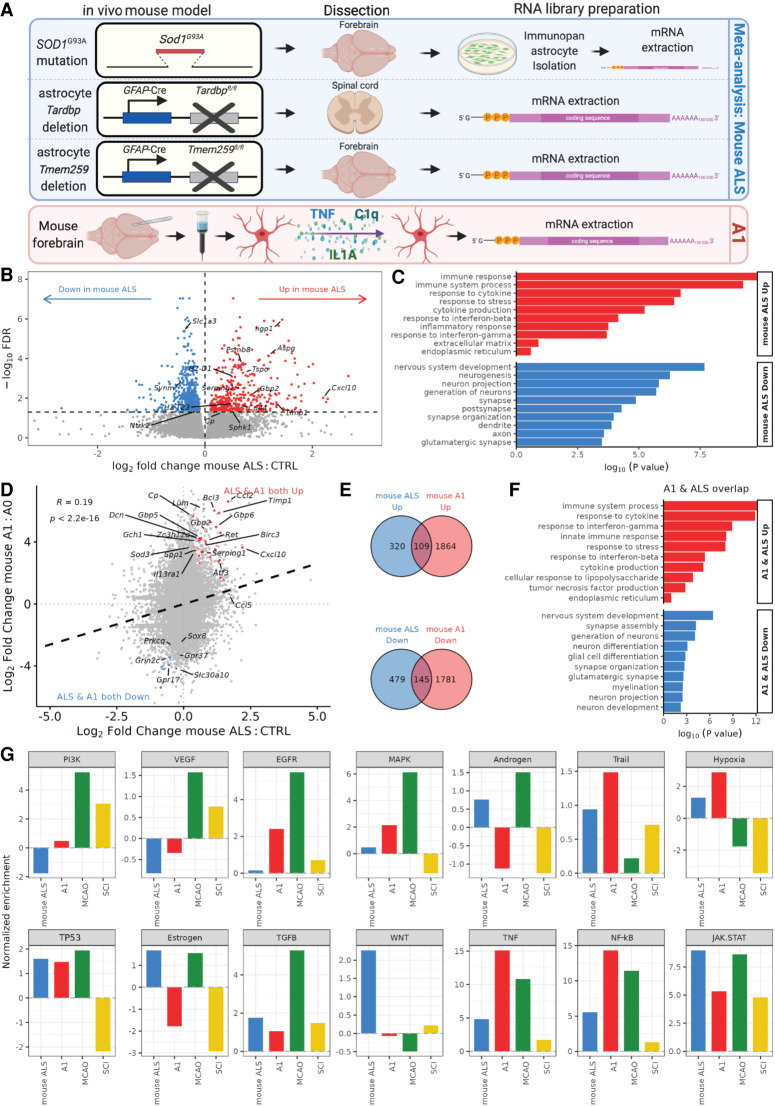
Figure 4.
Meta-analysis of astrocyte-specific ALS mouse models and A1 astrocyte correlation. (A) Schematic depicting mouse in vivo models: ALS SOD1G37R mutant mouse forebrain HepaCAM immunopanned isolated and cultured astrocytes in serum-free conditions; astrocyte-specific Tardbp deletion using conditional GFAP-Cre recombinase promoter followed by spinal cord dissection; astrocyte-specific Tmem259 deletion (GFAP-Cre promoter) forebrain dissection; and mouse forebrain isolated astrocytes treated with A1 factors before mRNA library preparation and sequencing. (B) Volcano plot showing log2 fold change in differential gene expression from the mouse ALS model meta-analysis for mouse ALS versus control. Genes with significantly (FDR < 0.05) increased expression are shown in red, and those decreased in expression are shown in blue. (C) GO terms enriched in up-regulated (red) and down-regulated (blue) differentially expressed genes in mouse ALS versus control astrocytes. (D) Scatterplot of log2 fold changes in gene expression in mouse ALS versus control astrocytes (x-axis) against mouse A1 versus A0 astrocytes (y-axis). Black dashed line indicates linear regression correlation (Pearson's correlation R = + 0.19). Overlapping differentially expressed genes are colored red (up-regulated) and blue (down-regulated). (E) Venn diagram depicting the overlap of up-regulated (top) or down-regulated (bottom) genes (FDR < 0.05) in mouse ALS versus control (blue) and mouse A1 versus A0 astrocytes (red). (F) Bar graph showing curated overrepresented functional categories (FDR < 0.05) by GO analysis of the 109 genes commonly up-regulated (red) and 145 co-down-regulated (blue) between mouse A1 and mouse ALS astrocytes. (G) PROGENy signaling pathway activity normalized enrichment scores (NESs) for the mouse ALS (blue), mouse A1 (red), MCAO (green), and SCI (yellow) data sets.

