Figure 3.
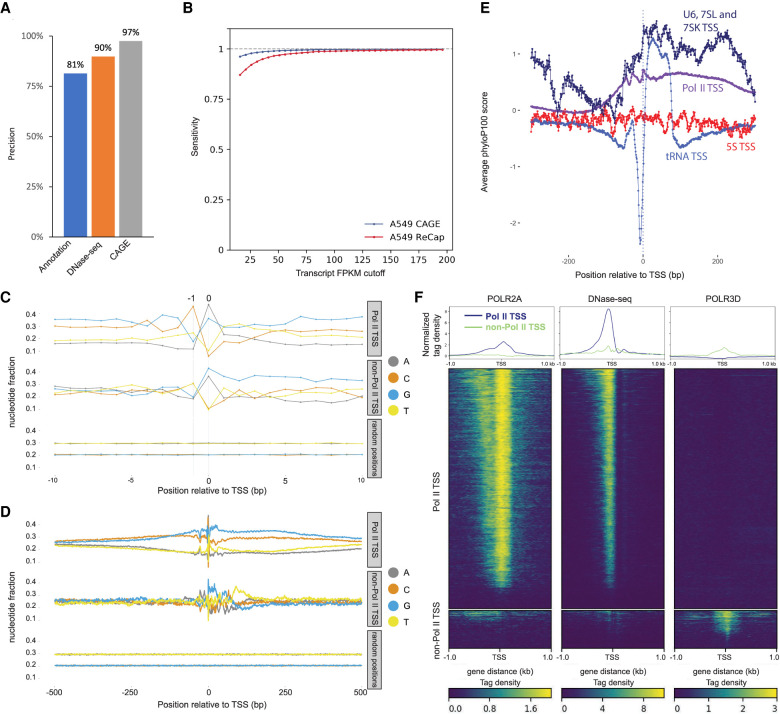
TSS Characterization. (A) Precision (TP/(TP + FP)) × 100 of ReCappable-seq. (TP) True positive, (FP) false positive (see Methods). (B) Sensitivity (TP/(TP + FN)) of ReCappable-seq. (TP) True positive (ReCappable-seq TSS with UCSC annotation), (FP) false positive (TSSs in UCSC annotation but not detected by ReCappable-seq; see Methods). (C) Nucleotide composition in the 20-bp flanking region for Pol II TSSs (top), non–Pol II TSSs (middle), and randomized genomic positions (bottom). (D) Same as C for 1-kb flanking region; 83.7% and 79.5% of Pol II and non–Pol II TSSs, respectively, start with A or G. (E) Conservation profiles using phyloP basewise conservation score (Pollard et al. 2010) derived from MULTIZ alignment (Blanchette et al. 2004) of 100 vertebrate species around Pol II TSSs (purple), tRNA TSSs (light blue), 5S TSSs (red), and U6, 7SL, and 7SK TSSs (dark blue). (F) Profiles and heatmaps of Pol II (left panel) and Pol III (right panel) ChIP-seq and DNase-seq (middle panel) at Pol II TSSs and non–Pol II TSSs. The Pol II ChIP-seq and DNase-seq data have been downloaded from the ENCODE website (Davis et al. 2018); the Pol III ChIP-seq data have been obtained from Oler et al. (2010).

