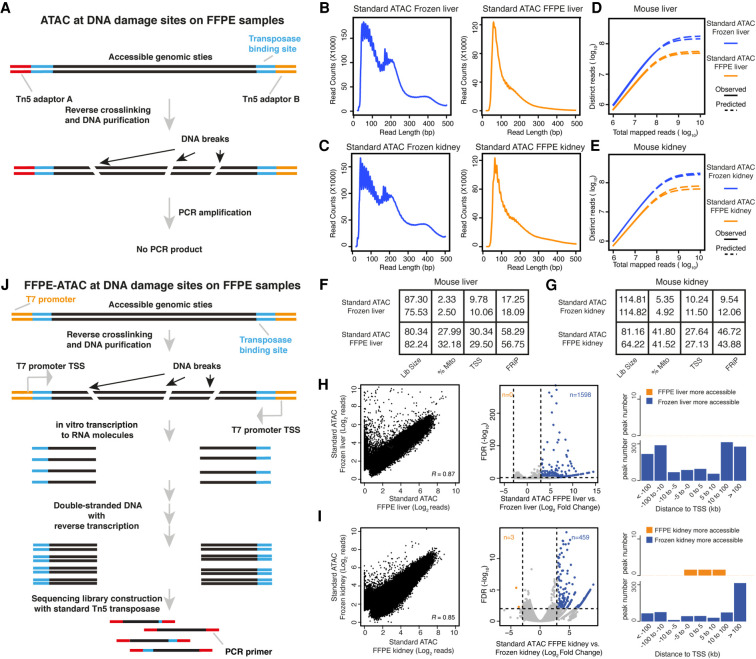
Figure 1.
Standard ATAC-seq on FFPE samples and design of FFPE-ATAC. (A) DNA damage on accessible chromatin sites in FFPE samples hampers PCR amplification in standard ATAC-seq on FFPE samples. (B–E) Comparison of DNA fragment size distribution (B,C) and library complexity (D,E) from standard ATAC-seq on frozen mouse liver and kidney and from standard ATAC-seq on FFPE mouse liver and kidney. (F,G) Quality-control metrics of standard ATAC-seq on frozen mouse liver (F) and kidney (G), and standard ATAC-seq on FFPE mouse liver (F) and kidney (G). (Lib size) Total sequencing reads of sequencing library (million); (%Mito) percentage of mitochondria; (TSS) enrichment score at transcription start sites (TSSs); (FRiP) fraction of reads in peaks. (H,I) Comparison of chromatin accessibility between standard ATAC-seq on frozen samples and FFPE samples. (Left) Genome-wide comparison of accessible chromatin regions. (R) Pearson's correlation. (Middle) Differential peak analysis between standard ATAC-seq on frozen samples and FFPE samples. (FDR) False-discovery rate. (Right) Distribution of the more accessible regions from frozen and FFPE mouse samples across TSSs. (J) Design of FFPE-ATAC by combining T7-Tn5 transposase tagmentation and T7 in vitro transcription.

