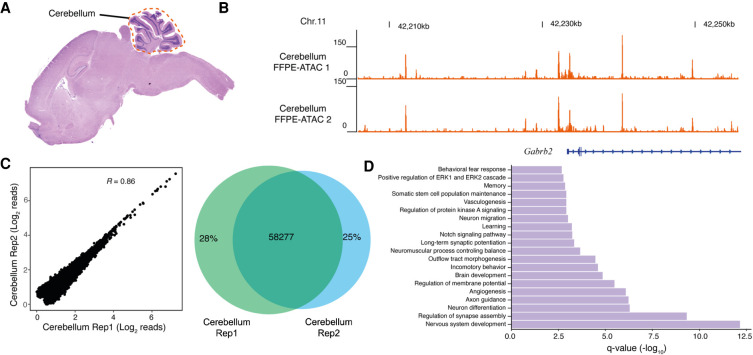
Figure 3.
FFPE-ATAC decodes chromatin accessibility from the mouse cerebellum with the aid of hematoxylin and eosin (H&E) staining. (A) H&E staining of a mouse FFPE brain tissue section, where the location of the cerebellum is illustrated with a dotted line. (B) Genome browser tracks of results from FFPE-ATAC analyses of isolated mouse FFPE cerebellum. (Chr.) Chromosome. (C) Reproducibility of FFPE-ATAC analyses of mouse FFPE cerebellum. (Left) The genome-wide correlation from the FFPE-ATAC reads. (Right) The overlapping peaks from the FFPE-ATAC in the two technical replicates. (R) Pearson's correlation. (D) Enrichment of Gene Ontology terms for the top 10,000 FFPE-ATAC peaks for the mouse FFPE cerebellum.

